Web Administration
Administration Interface
The Administration Interface is the main interface used to configure the NG Firewall.
Upon the first visit to the administration interface, a registration and welcome message is displayed. The message suggests applications that may be useful for your network. You can choose to install or manually install the recommended apps.
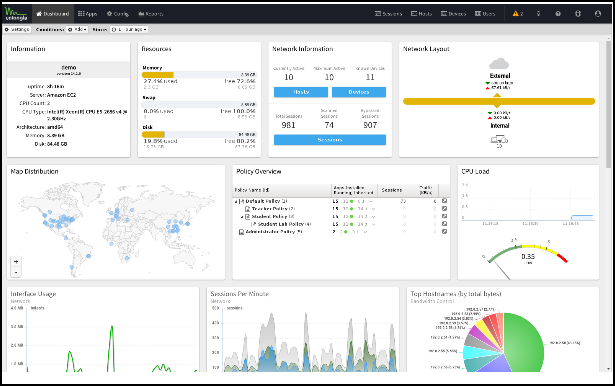
- Dashboard
- Applications
- Config
- Reports (only visible if the Reports app is installed.)
Dashboard
The Dashboard provides an overview of the state of your NG Firewall. It is extremely useful for quickly viewing or monitoring what is happening on the network and the current status of the NG Firewall server.
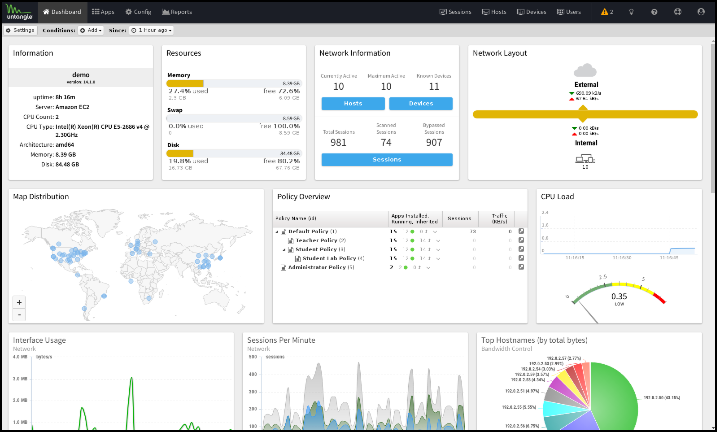
By default, the Dashboard will show several widgets with varying information. However, the Dashboard is completely customizable. Widgets can be removed and added so the administrator sees exactly the information that is important to them on the Dashboard.
There are many different types of widgets available:
| Name | Information |
|---|---|
| Information | Shows some information about the NG Firewall, like name, model, version, etc. |
| Resources | Show an overview of current memory swap and disk usage. |
| CPU Load | Shows a graph of recent CPU load. |
| Network Information | Shows an overview of the network information, such as session count and device/host count. |
| Network Layout | Shows an overview of the network layout based on the interface configuration. |
| Map Distribution | Shows the current sessions' mapped geo-location on a world map, sized by throughput. |
| Report | Shows any Report Entry from Reports. |
Click Manage Widgets at the top to change what is displayed on the dashboard. From here, you can show or hide the built-in widgets or add new widgets from Reports by clicking on the Add button.
When adding a Report widget, specify a time frame (the number of hours worth of data to display) and a refresh interval (how often the widget refreshes on the dashboard).
When viewing a Report Entry in Reports, you can easily add it to your Dashboard by clicking the Add to Dashboard button.
Administration Notifications
Administration Notifications appear as an exclamation point icon at the top of the rack when logged into the Administration interface or in the "Notifications" widget on the dashboard.
Overview
When logging in, the server will run a series of tests, which can take a few minutes, and then it will display the administration alert icon if there are any alerts. Tests are only performed on login; to force a retest, refresh the browser or click refresh on the Notification widget on the dashboard.
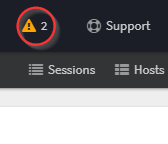
Notifications are displayed to alert the administrator of common mis-configurations or issues.
Notifications
| Text | Description |
|---|---|
| Upgrades are available and ready to be installed. | The server detected software upgrades that have yet to be applied. Upgrades can be applied in . |
| DNS connectivity failed: DNS Server IP | The specified server's DNS settings are not providing DNS resolution. Check the DNS settings of your WAN interfaces in . It is recommended that you use your ISP's DNS servers. |
| Failed to connect to Arista. [address:port] | Arista failed to connect to the Arista servers successfully. Check your network settings to ensure they are valid and that Arista is online. Also, check that no firewall between Arista and the internet could block connectivity. Arista requires an active connection to the internet for proper operation. |
| Free disk space is low. [ xx% free ] | Free disk space is running low. Contact Arista support for help determining what is using disk space and what to do about it. Please note that our recommended minimum hard disk size is at least 80 Gigs. |
| Disk errors were reported. Error text | The disk (hard drive) returned some errors for certain commands. This usually means the disk has bad sectors which are non-responsive. In this case, the disk (hard drive) should be replaced immediately. |
| Rack Name contains two or more Application 1 | The given rack contains two or more instances of the same application. While possible, this is never desired as it decreases performance and increases management complexity. Remove one of the duplicate applications. |
| Rack Name contains redundant apps: Application 1 and Application 2. | Some applications in Arista are redundant and should be installed in a different rack simultaneously. For example, Spam Blocker is a super-set to Spam Blocker Lite. If both are run, no additional spam will be blocked, but messages will be scanned twice, incurring a performance hit. Remove the redundant application. |
| Bridge (Interface 1 <-> Interface 2) may be backward. Gateway (Gateway IP) is on Interface 2. | Often, bridges can be plugged in with the WAN interfaces on the LAN and the LAN interface on the WAN. This works and passes traffic; however, several applications do not behave as expected. If shown, ngfW has detected that the gateway for the main bridge interface is not on the expected interface. It is recommended to go into and unplug each interface one at a time, verifying and correcting the mapping of interfaces by swapping cables around. |
| Interface 1 interface NIC has a high number of RX/TX errors. | This indicates that ifconfig shows a high number of RX or TX errors on the given interface card. This is typically a network layer or NIC issue. If possible, try another NIC or duplex setting in /admin/index.do#config/network/advanced/network_cards. |
| Spam Blocker [Lite] is installed, but an unsupported DNS server is used | Spam Blocker and Spam Blocker Lite rely on DNSBL (DNS blacklists) to categorize spam. Several publicly available and often used DNS servers do not supply access to these services. For example, google (8.8.8.8, 8.8.4.4), open DNS (208.67.222.222, 208.67.222.220), level 3 (4.2.2.1,4.2.2.2) do not provide resolution for DNSBL queries. Configuring Arista to use your ISPs DNS servers for effective spam filtering is recommended. If spam filtering is not required, uninstall the application from the rack. |
| Spam Blocker [Lite] is installed, but a DNS server (X,Y) fails to resolve DNSBL queries. | This means one configured DNS server does not properly resolve DNSBL queries. This will greatly degrade Spam Blocker and Spam Blocker Lite's ability to detect spam. Try configuring a different DNS server. To test this, manually run host 2.0.0.127.zen.spamhaus.org your_DNS_server in the terminal where "your_DNS_server" is the IP of your DNS server. If it does not return results, then DNSBL queries are not properly resolved by that server. |
| Web Filter is installed, but a DNS server (X,Y) fails to resolve categorization queries. | This means one configured DNS server does not properly resolve Web Filter category queries. Web Filter uses DNS to categorize unknown sites. If the configured DNS servers do not properly respond to categorization queries, then Web Filter will not function correctly and may slow web traffic significantly. |
| A DNS server responds slowly. (X,Y,Z) This may negatively affect Web Filter performance. | A DNS server responds slowly (X,Y,Z), which may negatively affect Web Filter performance. This means the specified DNS server (Y) on the interface (X) responded slowly (in Z milliseconds) to a Web Filter categorization request. Web Filter will automatically request categorization of unknown and never-before-seen URLs. If DNS performs poorly, Web Filter categorization will also be slow and may negatively affect web traffic latency as Web Filter categorizes websites. |
| Event processing is slow (x ms). | Event logging is slow. This is shown when event logging takes more than 15ms on average. This can be caused by a slow disk or an extremely busy server. If you see this message, you can try a couple of things.
|
| Event processing is delayed (x minute delay). | The event logging daemon that logs events to the database is behind. This happens when "events" happen quicker than when the events can be written in the database. A slow disk or a busy network can cause this. Events will be stored in queued memory until they can be written to the disk. If the time it takes for an event to happen to be logged to the database reaches a time greater than 10 minutes, this warning will appear. This is not necessarily an issue, but the administrator should be aware when viewing reports and events that they will be delayed by x minutes. You can try a few things to resolve this alert:
|
| Packet processing recently overloaded | This warning means that at "nf_queue: full at * entries, dropping packets(s)" was found in /var/log/kern.log." This means packets were incoming faster than the server could handle them. This usually indicates some misconfiguration or performance issue or that some traffic needs to be Bypass Rules. This indicates that the server is undersized for the current task and needs more memory (swapping) disk I/O throughput or processing power. For further help with this alert, contact Arista support. |
| The shield is disabled. This can cause performance and stability problems. | The shield is disabled in . While sometimes useful for testing, this configuration will cause performance and stability problems. To verify that Enable Shield is checked. |
| Route to unreachable address: 1.2.3.4 | A static route exists in , but the next hop is unreachable. All traffic for this route will be dropped. |
| Currently, the number of devices significantly exceeds the number of licensed devices. (x > y) | The number of devices for which ngfW has recently processed traffic (x) is greater than the number of allowed devices (y) for the license existing on the ngfW server. o return to compliance, bypassing devices or getting a larger license may be necessary. Contact This email address is being protected from spambots. You need JavaScript enabled to view it. for help. |
| DNS and DHCP services are not functioning. | This means that the DNS and DHCP service is not properly functioning. This serious issue must be resolved for Arista to function properly. The usual cause of this is invalid options or syntax in , or in the interface settings in . |
| The timezone has been changed since boot. A reboot is required. | The timezone has been reconfigured since boot-up, and a reboot is required as soon as possible. |
| An upgrade process has been interrupted. | An upgrade has been interrupted. This is usually the result of rebooting during an upgrade using an alternate upgrade process, running multiple upgrades at once, or some other similar scenario. Contact Arista support. (Be sure Support access is enabled in !) |
Event Definitions
All event data is stored in the Mail messages in a relational database. As Arista and applications process traffic, they create Event objects that add and modify content in the database. Each event has it's class/object with certain fields that modify the database in a certain way.
The list below shows the classes used in the event logging and the attributes of each event object. These can add alerts in Reports or other event handling within Arista.
SpamLogEvent
These events are created by Spam Blocker, and the Database Schema table is updated when an email is scanned.
| Attribute Name | Type | Description getAction |
|---|---|---|
| action | SpamMessageAction | The action getClass |
| class | Class | The class name getClientAddr |
| clientAddr | InetAddress | The client address getClientPort |
| clientPort | int | The client port getmessageId |
| messageId | Long | The message ID getPartitionTablePostfix getReceiver |
| receiver | String | The receiver getScore |
| score | float | The score getSender |
| sender | String | The sender getServerAddr |
| serverAddr | InetAddress | The server address getServerPort |
| serverPort | int | The server port getSmtpMessageEvent |
| smtpMessageEvent | SmtpMessageEvent | The parent SMTP message event isSpam |
| isSpam | boolean | True if spam, false otherwise getSubject |
| subject | String | The subject getTag getTestsString |
| testsString | String | The tests string from the spam engine getTimeStamp |
| timeStamp | Timestamp | The timestamp getVendorName |
| vendorName | String | The application name |
SpamSmtpTarpitEvent
These events are created by Spam Blocker and inserted into the Database Schema table when a session is tarpitted.
| Attribute Name | Type | Description getIPAddr |
|---|---|---|
| IPAddr | InetAddress | The IP address getClass |
| class | Class | The class name getHostname |
| hostname | String | The host name getPartitionTablePostfix getSessionEvent |
| sessionEvent | SessionEvent | The session event getSessionId |
| sessionId | Long | The session ID getTag getTimeStamp |
| timeStamp | Timestamp | The time stamp getVendorName |
| vendorName | String | The application name |
PrioritizeEvent
The Bandwidth ControlDatabase Schema creates these events and updates the table when a session is prioritized.
| Attribute Name | Type | Description getClass |
|---|---|---|
| class | Class | The class name getPartitionTablePostfix getPriority |
| priority | int | The priority getRuleId |
| ruleId | int | The rule ID getSessionEvent |
| sessionEvent | SessionEvent | The session event getTag getTimeStamp |
| timeStamp | Timestamp | The timestamp |
VirusFtpEvent
Virus Blocker creates these events and updates the Database Schema table when Virus Blocker scans an FTP transfer.
| Attribute Name | Type | Description getAppName |
|---|---|---|
| appName | String | The name of the application getClass |
| class | Class | The class name getClean |
| clean | boolean | True if clean, false otherwise getPartitionTablePostfix getSessionEvent |
| sessionEvent | SessionEvent | The session event getTag getTimeStamp |
| timeStamp | Timestamp | The timestamp getUri |
| uri | String | The URI getVirusName |
| virusName | String | The virus name, if not clean |
VirusHttpEvent
These events are created by Virus Blocker and update the Database Schema table when Virus Blocker scans an HTTP transfer.
| Attribute Name | Type | Description getAppName |
|---|---|---|
| appName | String | The name of the application getClass |
| class | Class | The class name getClean |
| clean | boolean | True if clean, false otherwise getPartitionTablePostfix getRequestLine |
| requestLine | RequestLine | The request line getSessionEvent |
| sessionEvent | SessionEvent | The session event getTag getTimeStamp |
| timeStamp | Timestamp | The timestamp getVirusName |
| virusName | String | The virus name, if not clean |
VirusSmtpEvent
Virus Blocker creates these events and updates the Database Schema table when Virus Blocker scans an email.
| Attribute Name | Type | Description getAction |
|---|---|---|
| action | String | The action getAppName |
| appName | String | The name of the application getClass |
| class | Class | The class name getClean |
| clean | boolean | True if clean, false otherwise getmessageId |
| messageId | Long | The message ID getPartitionTablePostfix getTag getTimeStamp |
| timeStamp | Timestamp | The timestamp getVirusName |
| virusName | String | The virus name, if not clean |
FirewallEvent
Firewall creates these events, and the Database Schema table is updated when a firewall rule matches a session.
| Attribute Name | Type | Description getBlocked |
|---|---|---|
| blocked | boolean | True if blocked, false otherwise getClass |
| class | Class | The class name getFlagged |
| flagged | boolean | True if flagged, false otherwise getPartitionTablePostfix getRuleId |
| ruleId | long | The rule ID getSessionId |
| sessionId | Long | The session ID getTag getTimeStamp |
| timeStamp | Timestamp | The timestamp |
Events
Events control the handling of "events" in the NG Firewall.
When noteworthy actions occur within the NG Firewall and the apps, an "event" is logged. An event is an object that describes an action. For example, an HttpRequestEvent is logged when a client on the network makes an HTTP Request, and a SessionEvent is logged when a PC creates a network connection.
The Event Definitions page details all of the events and the attributes.
- Evaluate the Alert Rules below section and create, log, and send an alert if necessary.
- Evaluate Trigger Rules from the below section and take action if necessary.
- Evaluate Syslog Rules from the below section and send a syslog message if necessary.
- If installed, send the event to Reports to save it in the reports database.
Alerts
Alert rules are evaluated on all events logged and will log and/or alert the administrator when interesting or noteworthy events occur.
Unlike most rules, all Alert rules are evaluated beyond the first matching rule.
- Enable determine if the Alert rule is enabled.
- Class is the type of event this rule matches. Selecting the Class will determine what Fields are available in the conditions.
- Conditions list the fields within the event object to be checked. If all of the conditions match, then the rule will match.
- Enable Thresholds to limit the Alert from firing until it reaches a certain frequency threshold.
- Exceeds Threshold Limit is the frequency limit for which this condition will match. If the frequency is greater than this value, then the threshold conditions match.
- Over Timeframe defines the time range, in seconds, to compute the frequency.
- Grouping Field defines how to group thresholds by an attribute field in the events. This field is optional.
- Log Alert logs the event to the Alert Event Log.
- Send Alert sends an email to all administrators' emails describing the event.
- Limit Send Frequency limits the number of times a rule can send an alert email to once per the configured number of minutes. For some cases, like a low disk space alert, limiting the number of alerts sent is useful so that an alert is not sent every minute.
If the threshold limit exceeds 100 and The over-time frame is 60, then the threshold condition will only match when these rules and other conditions match approximately 100 times over any 60 seconds. If the Group Field is set to "CClientAddr," then the threshold load is grouped by the "CClientAddr" value in the event objects. The above example would mean that the Alert would only fire when a specific "CClientAddr" like "192.168.1.100" does something over 100 times within 60 seconds. The threshold value for other clients like "192.168.1.150" is tracked separately.
Adding Alert Rules
Writing and designing alert rules is an art.
Start by finding an event that describes the action you want to be alerted about. The Event Definitions describe all the event objects and the attributes associated with each object.
Set the Class to the event you want to alert about, then add conditions that check the fields to look for the events you are interested in.
Let's say we want to set up an alert when a specific user visits a specific website.
As a Class, select HttpRequestEvent. Then, as a field, add domain = example.com and sessionEvent.username = example_user.
We want to know if this user visits this website a single time, so we want to leave the threshold as is. We want it to log this alert, so we want to check Log, and we want to send an email, so we're going to check Send Email.
However, when a user visits a website, many separate HTTP requests are made to load all components. We do not want to receive 20 emails each time a user visits a single page on that website. We want to check the Limit Send Frequency to 20 minutes so we aren't flooded with emails.
Many other alert rules are not enabled by default, which can provide some common examples.
Triggers
Triggers are similar to Alert rules; however, instead of alerting when something interesting happens, trigger rules can "tag" a specific host, device, or user for a specific period.
Unlike most rules, all Trigger rules are evaluated beyond the first matching rule.
This allows the system to keep a state on the different hosts on the network, which can serve several purposes. For example, you can tag a specific host/device/user as using a specific application when the application is used.
- Enable determine if the alert rule is enabled.
- Class is the type of event this rule matches. Selecting the Class will determine what Fields are available in the conditions.
- Conditions list the fields within the event object to be checked. If all of the conditions match, then the rule will match.
- Enable Thresholds to limit the alert from firing until it reaches a certain frequency threshold.
- Exceeds Threshold Limit is the frequency limit for which this condition will match. If the frequency is greater than this value, then the threshold conditions match.
- Over Timeframe defines the time range, in seconds, to compute the frequency.
- Grouping Field defines how to group thresholds by an attribute field in the events. This field is optional.
- Action Type determines the action taken.
- Tag Host will tag the specified host with the specified tag.
- Untag Host will remove the specified tag from the specified host.
- Tag User will tag the specified user with the specified tag.
- Untag User will remove the specified tag from the specified user.
- Tag Device will tag the specified device with the specified tag.
- Untag Device will remove the specified tag from the specified device.
- Target identifies the specific host/device/user. If it is a single attribute name, 'cClientAddr,' it will look up to three layers deep within an object for any attribute named cClientAddr. If it is a fully qualified name like 'sessionEvent. ' cClientAddr,' it will look at that specific attribute within the specified sub-object.
- Tag Name specifies the string (name) of the tag to be given or removed.
- Tag Lifetime specifies the lifetime of the tag when adding a tag. After the lifetime expires, the tag will disappear.
Syslog
- Host: The hostname or IP address of the Syslog daemon authorized to receive syslog messages from the NG Firewall server. Do not set the Host to the NG Firewall itself. This will result in the hard drive filling up quickly and likely crashing the box.
- Port: The UDP port to send syslog messages to the syslog daemon. 514 is the default, as this is the default syslog port.
- Protocol: The protocol used to send syslog messages. The default is UDP.
Syslog Rules
WARNING: Syslog can be a very expensive operation. If configured to send all (or most) events, it can negatively impact the server's performance.
Syslog Rules determine which events are sent via syslog.
- Enable determine if the alert rule is enabled.
- Class is the type of event this rule matches. Selecting the Class will determine what Fields are available in the conditions.
- Conditions list the fields within the event object to be checked. If all of the conditions match, then the rule will match.
- Enable Thresholds to limit the alert from firing until it reaches a certain frequency threshold.
- Exceeds Threshold Limit is the frequency limit for which this condition will match. If the frequency is greater than this value, then the threshold conditions match.
- Over Timeframe defines the time range, in seconds, to compute the frequency.
- Grouping Field defines how to group thresholds by an attribute field in the events. This field is optional.
- Remote Syslog determines if the event is sent via syslog.
To send all events via syslog, create one rule where Class = All and no conditions.
To send specific events to a syslog server, configure the Syslog Rules to send the specific events to the syslog server.
Email Template
You can customize the content of email alerts by editing the Email Template. Items surrounded by the percent symbol represent system variables. You can use these throughout the Subject or Body of the message. The table below describes each variable.
| Variable | Information |
| System company | Your company name is defined in Branding Manager. |
| Alert description | The event description of the associated alert rule. |
| System host | The Hostname of your NG Firewall system. |
| Event class | The event class of the associated alert rule. |
| Event summary | The event summary of the associated alert rule. |
| Event values key value | The extended event details of the associated alert rule. |
The preview window shows in real time how your changes to the Subject or Body will appear in the email message content.
Reports
You can search and further define reports using the time selectors and the Conditions window at the bottom of the page. The data used in the report can be obtained on the Current Data window on the right.
Pre-defined report queries:
| Report Entry | Description |
|---|---|
| Admin Logins | The number of total, successful, and failed admin logins over time. |
| Settings Change | The number of settings changes over time. |
| Admin Login Events | All local administrator logins. |
| All Settings Changes | All settings changes are performed by an administrator. |
All Settings Changes
All Settings Changes is a report that provides a detailed view of any settings changes an administrator performs when upgrades are applied. This is available on all systems in the .
The Reports tab shows the timestamp when the change was made, the username and hostname that made the change, and the settings files that were changed.
Click the Differences button to see the exact changes made to the files. This feature uses a color-coded ‘diff’-like feature to show the differences.
Red = Line was removed
Green = Line was added
Yellow = Line was changed
Port Forward Rule Example
The following shows an example of adding a port forward for DNS to the system.
First, you can see the rule was added on 8/3/15 by the user admin from IP 10.24.24.40. The settings file that changed was network.js with the appropriate version-YYYY-MM-DD-time.js file name.
You can see all the changes by clicking the Differences button. Only the DNS rule was added for this instance; the changes are recorded below.
Applications
Applications are plugins that add functionality to your NG Firewall server like "apps" on an iPhone or Android device.
On the Apps tab, you'll see the installed apps. Across the top is a drop-down menu to switch to different policies. policies can be controlled via the Policy Manager app.
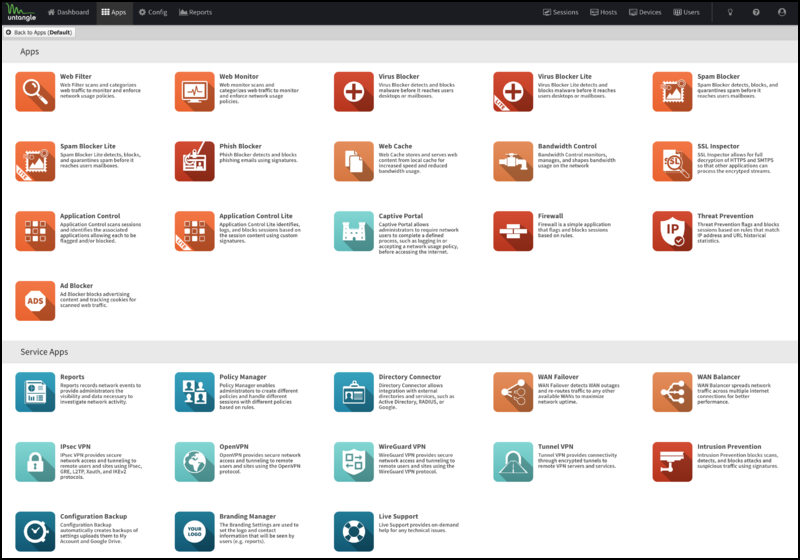
You can install apps by clicking the Install Apps button at the top. It will display the apps that can currently be installed. To install an app, click its icon. You can install as many apps as you like at the same time. After installing the desired apps, you can click the Done button at the top to return to the app view.
Once installed, the application's settings can be configured by clicking the Settings button or the app icon, depending on the skin. Applications install with the suggested configuration, which is the default setting and is on/enabled in most cases. An application that is off/disabled will not process any network traffic. To enable a disabled application, edit the settings and click Enable on the first tab inside the settings.
After clicking Settings, you will see tabs for different settings sections and typical buttons marked OK, Cancel, and Apply. Apply saves any changes. OK, it saves any changes and closes the window. Cancel closes the window without saving settings. On the left side, a Remove button will remove the application from the current policy. The Help button will open the help for the tab currently being viewed.
- Filter Applications All the Applications above the Services pane in the interface can have one instance per policy.
- Service Applications All the Applications below the Services pane are global and exist in all virtual racks.
Many networks only need one policy, which means all traffic gets processed by the same apps and configuration, but multiple policies (sometimes called "racks") are possible for bigger networks. Check out the Policy Manager application for more information about running multiple racks.
To learn more about each application, select the links below.
Filter Applications
Service Applications
 |
 |
 |
 |
 |
| Reports | Policy Manager | Directory Connector | Web Monitor | WAN Balancer |
 |
 |
 |
 |
 |
| Captive Portal | IPsec VPN | OpenVPN | WireGuard VPN | Branding Manager |
 |
 |
|||
| Configuration Backup | Live Support | |||
Devices
Devices view all current "devices" or unique MAC addresses on the local network(s).
Each row represents a single device (unique MAC address) seen on any LAN interface.
As the NG Firewall scans and processes network traffic, the platform and many apps will save information about devices on the network. This information is stored in the "Device Table," and the Devices view provides a view of the device table.
Controls
- Refresh refreshes the grid with the current active sessions.
- Reset View resets the view to the default view. Any changes to the default view are saved in your local browser session.
- Add can be used to add devices to the device table manually.
- Export exports the current device table to a JSON file.
- Import imports a JSON file into the device table.
- Sort Ascending sorts the selected column in ascending order.
- Sort Descending sorts the selected column in descending order.
- Columns allow the removal or addition of columns to the current view.
- Filter provides a way to filter current data on this column with the provided value.
- Save saves any changes manually made by the administrator.
Unlike Sessions and Hosts, the device table is saved and permanent. The administrator can edit, modify, and save the values of the attributes for each Device.
Columns
| Property | Description |
|---|---|
| MAC Address | The MAC address of this Device |
| MAC Vendor | The Vendor of the MAC address of this Device, if known |
| Interface | The interface on which this Device was last seen |
| Last Hostname | The last Hostname of this device that was learned automatically (via DHCP, DNS, or Directory Connector) |
| Hostname | The manually configured Hostname for this device - this will be blank unless set by the administrator |
| Username | The manually configured username for this device - this will be blank unless set by the administrator |
| HTTP User Agent | The HTTP User Agent of this device (according to a recent HTTP request) |
| Last Seen Time | The last time this device was seen on the network |
| Tags | The tags of this device |
Hosts
Hosts provide a view of all current "hosts" or unique IP addresses on the local network(s).
Each row represents a single host (unique IP address) seen on any LAN interface.
As the NG Firewall scans and processes network traffic, the platform and many apps save information about a host on the network. This information is stored in the "Host Table," and the Hosts view provides a view into the host table.
Controls
- Refresh refreshes the grid with the current active sessions.
- Auto Refresh toggles automatic refreshing of the grid.
- Reset View resets the view to the default view. Any changes to the default view are saved in your local browser session.
- Filter provides the ability to filter all sessions with many key attributes quickly.
Mousing over any column head and using the drop down menu on the column head allows you to access more controls.
- Sort Ascending sorts the selected column in ascending order.
- Sort Descending sorts the selected column in descending order.
- Columns allow the removal or addition of columns to the current view.
- Filter provides a way to filter current data on this column with the provided value.
Columns
| Property | Description |
|---|---|
| MAC Vendor | The Vendor of the MAC address of this Host if known |
| Interface | The interface on which this Host was last seen |
| Creation Time | The creation time of this Host entry |
| Last Access Time | The last time an app or the platform accessed this Host entry |
| Last Session Time | The last time this host attempted to create a session |
| Address | The IP address of this Host |
| MAC Address | The MAC address of this Host if it is known |
| MAC Vendor | The Vendor of the MAC address of this Host if known |
| Interface | The interface on which this Host was last seen |
| Creation Time | The creation time of this Host entry |
| Last Access Time | The last time an app or the platform accessed this Host entry |
| Last Session Time | The last time this host attempted to create a session |
| ast Completed TCP Session Time | The last time this host successfully completed a TCP session to a WAN address |
| Entitled Status | False if this host is not entitled to premium functionality because the limit is exceeded True otherwise |
| Active | True if this host is considered "active," False otherwise |
| HTTP User Agent | The HTTP User Agent of this host (according to a recent HTTP request) |
| Captive Portal Authenticated | True if this Host is authenticated with Captive Portal (at least one) |
| Tags | The tags of this Host |
| Tags String | The tags of this Host |
| Hostname | The official Hostname of this host |
| Hostname Source | The source of the official Hostname of this host |
| Hostname (DHCP) | The hostname of this host according to DHCP (Hosts often specify their hostname when retrieving a DHCP lease) |
| Hostname (DNS) | The hostname of this host according to reverse DNS |
| Hostname (Device) | The hostname of this host's MAC address according to Devices |
| Hostname (Device Last Known) | The last known hostname of this host's MAC address according to Devices |
| Hostname (OpenVPN) | The hostname according to OpenVPN |
| Hostname (Reports) | The hostname according to the Name Map in Reports |
| Hostname (Directory Connector) | The hostname according to Directory Connector |
| Username | The official Username associated with this host |
| Username Source | The source of the official Username |
| Username (Directory Connector) | The username according to Directory Connector |
| Username (Captive Portal) | The username according to Captive Portal |
| Username (Device) | The username of this host's MAC address according to Devices |
| Username (OpenVPN) | The username according to OpenVPN |
| Username (IPsec VPN) | The username according to IPsec VPN |
| Quota Size | The size of this host's quota (in bytes) |
| Quota Remaining | The amount of quota remaining (in bytes) |
| Quota Issue Time | The original issue time of this host's quota |
| Quota Expiration Time | The expiration time of this host's quota |
| Refill Quota | Refill Quota action will refill this Host's quota |
| Drop Quota | Refill Quota action will remove this Host's quota |
Sessions
Sessions provide a view of the current sessions (also known as connections).
Each row represents a single network session/and its properties.
As the NG Firewall and all the apps learn more about a session, many will "attach" data to the session so it is globally visible and accessible to other apps. The Sessions view provides a view into everything known about each session.
The Sessions view provides a real-time view of the network and can also be very useful for debugging. The controls allow you to view the current sessions of a specific application, host, user, website, or policy. This can be used to view activity or verify that traffic is being handled properly by the proper policy.
Controls
- Refresh refreshes the grid with the current active sessions.
- Auto Refresh toggles automatic refreshing of the grid.
- Reset View resets the view to the default view. Any changes to the default view are saved in your local browser session.
- Filter provides the ability to filter all sessions with many key attributes quickly.
Mousing over any column head and using the drop down menu on the column head allows you to access more controls.
- Sort Ascending sorts the selected column in ascending order.
- Sort Descending sorts the selected column in descending order.
- Columns allow the removal or addition of columns to the current view.
- Group this Field will group the session data by the selected column.
- Filter provides a way to filter current data on this column with the provided value.
Columns
| Property | Description |
|---|---|
| Creation Time | The creation time of the session (if scanned) |
| Session ID | The session ID (if scanned) |
| Mark | The netfilter connmark |
| Protocol | The protocol of the session (TCP/UDP) |
| Bypassed | True if the session is bypassed, False if it is scanned |
| Policy | The policy handling the session (if scanned) |
| Hostname | The hostname for the client address (if known) |
| NATd | True if the client address of the session was rewritten (NAT), False otherwise |
| Port Forwarded | True if the server address of the session was rewritten (port-forward), False otherwise |
| Tags | The tags attached to the session (inherited from Hosts, Devices, and Users) |
| Tags String | The list of all tags attached to the session. |
| Local Address | The IP address of the "local" (non-WAN) participant or the Client Address if no local address. |
| Remote Address | The IP address of the "remote" (WAN) participant or the Server Address if there is no remote address. |
| Bandwidth Control Priority | The priority of the session is set by Bandwidth Control. |
| QoS Priority | The priority set by QoS. |
| Pipeline | The application processing order (pipeline) of the session (if scanned). |
| Client Interface | The network interface of the client (source). |
| Client Address (Pre-NAT) | The IP address of the client (initiator) of the session. |
| Client Port (Pre-NAT) | The port of the client (initiator) of the session. |
| Client Address (Post-NAT) | The IP address of the client (initiator) of the session post-NAT. |
| Client Port (Post-NAT) | The port of the client (initiator) of the session post-NAT. |
| Client Country | The country code of the client IP address. |
| Client Latitude | The latitude of the client's IP address. |
| Client Longitude | The longitude of the client IP address. |
| Server Interface | The network interface of the server (destination). |
| Server Address (Pre-NAT) | The IP address of the server (receiver) of the session pre-NAT. |
| Server Port (Pre-NAT) | The port of the server (receiver) of the session pre-NAT. |
| Server Address (Post-NAT) | The IP address of the server (receiver) of the session. |
| Server Port (Post-NAT) | The port of the server (receiver) of the session. |
| Server Country | The country code of the server IP address. |
| Server Latitude | The latitude of the server IP address. |
| Server Longitude | The longitude of the server IP address. |
| Speed (KB/s) Client | The data rate of data sent by the client (updated every 60 seconds). |
| Speed (KB/s) Server | The data rate of data sent by the server (updated every 60 seconds). |
| Speed (KB/s) Total | The data rate of the session (updated every 60 seconds). |
| Application Control Lite Protocol | The protocol according to Application Control Lite. |
| Application Control Lite Category | The category according to Application Control Lite. |
| Application Control Lite Description | The description of the protocol according to Application Control Lite. |
| Application Control Lite Matched? | True if Application Control Lite matched the session. |
| Application Control Protochain | The protochain of Application Control |
| Application Control Application | The application of Application Control |
| Application Control Category | The category of the application of Application Control |
| Application Control Detail | The details of the application of Application Control |
| Application Control Confidence | The confidence of the match of Application Control |
| Application Control Productivity | The productivity of the application of Application Control |
| Application Control Risk | The risk of the application of Application Control |
| Web Filter Category Name | The category of the last web request according to Web Filter |
| Web Filter Category Description | The description of the category of the last web request according to Web Filter |
| Web Filter Category Flagged | True if this category of the web request is flagged, False if not, null otherwise |
| Web Filter Category Blocked | True if this category of the web request is blocked, False if not, null otherwise |
| Web Filter Flagged | True if the last web request is flagged, False if not, null otherwise |
| HTTP Hostname | The HTTP hostname is an HTTP session. |
| HTTP URL | The HTTP URL of the last HTTP request of this session. |
| HTTP User Agent | The HTTP User Agent of the last HTTP request of this session. |
| HTTP URI | The HTTP URI of the last HTTP request of this session. |
| HTTP Request Method | The HTTP Request Method of the last HTTP request of this session. |
| HTTP Request File Name | The HTTP Request filename is the last HTTP request of this session. |
| HTTP Request File Extension | The HTTP Request filename extension (.exe) of the last HTTP request of this session. |
| HTTP Request File Path | The HTTP Request file path of the last HTTP request of this session. |
| HTTP Content Type | The HTTP Content Type of the last HTTP response of this session. |
| HTTP Referrer | The HTTP Referrer of the last HTTP request of this session. |
| HTTP Response File Name | The HTTP Response filename is the last HTTP response of this session. |
| HTTP Response File Extension | The HTTP Response filename extension (.exe) of the last HTTP response of this session. |
| HTTP Content Length | The HTTP content length of the last HTTP response of this session. |
| SSL Subject DN | The Subject DN of the SSL certificate of this session. |
| SSL Issuer DN | The Issuer DN of the SSL certificate of this session. |
| SSL Inspected | True if SSL Inspected, False if not inspected, null otherwise. |
| SSL SNI Hostname | The SNI hostname is specified in the request for this session (if specified). |
| FTP Filename | The name of the last file downloaded in this session via FTP. |
| FTP Data Session | True if this is an FTP data session; it is null otherwise. |
Users
Users provide a view of all current users or unique usernames on the local network(s).
The User Management documentation describes the basics of users and user management.
Each row represents a single user (unique username) seen on any LAN interface.
As the NG Firewall scans and processes network traffic, the platform and many apps will save information about users on the network.
This information is stored in the "User Table," and the Users view provides a view into the user table.
Controls
- Refresh refreshes the grid with the current active sessions.
- Reset View resets the view to the default view. Any changes to the default view are saved in your local browser session.
- Add can be used to add users to the user table manually.
- Export exports the current user table to a JSON file.
- Import imports a JSON file into the user table.
- Sort Ascending sorts the selected column in ascending order.
- Sort Descending sorts the selected column in descending order.
- Columns allow the removal or addition of columns to the current view.
- Filter provides a way to filter current data on this column with the provided value.
- Save saves any changes manually made by the administrator.
Unlike Sessions and Hosts, the user table is saved and permanent. The administrator can edit, modify, and save the values of the attributes for each User.
Quotas
- View the status of user quotas.
- Override the default quota.
- Refill the quota.
- Drop the quota.
Columns
| Property | Description |
|---|---|
| Username | The username of this entry |
| Creation Time | The creation time for this user entry |
| Last Access Time | The last time this user entry was accessed |
| Last Session Time | The last time this user created a network session |
| Quota Size | The size of this host's quota (in bytes) |
| Quota Remaining | The amount of quota remaining (in bytes) |
| Quota Issue Time | The original issue time of this host's quota |
| Quota Expiration Time | The expiration time of this host's quota |
| Quota Refill | Refill Quota action will refill this Host's quota |
| Quota Drop | Drop Quota action will remove this Host's quota |
| Tags | the tags of this user |
Local Users
Local Users stores a list of users that the applications can use.
For example, Captive Portal and OpenVPN can select the local directory to authenticate users.
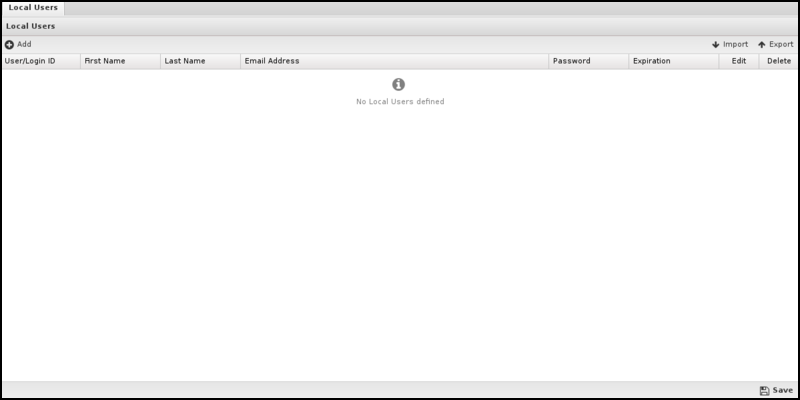
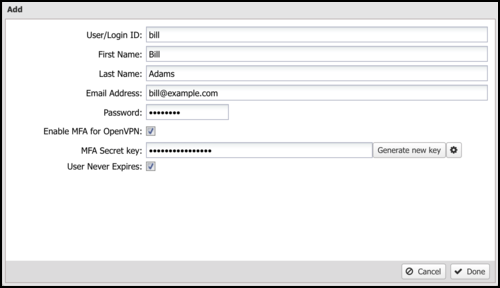
To add new users, click the Add button. You must supply a username, first name, last name, email address, and password. Only the administrator can set the password for a given user. Users can be imported or exported using the import/export buttons on the upper right.
A user can be specified with an expiration date. The user will no longer be authenticated if the expiration date has passed.
To select the Local Directory, configure apps such as Captive Portal and OpenVPN to authenticate against the Local Directory while requiring user authentication.
MFA and OpenVPN
You can enable TOTP-based multi-factor authentication for OpenVPN client connections. Select Enable MFA for OpenVPN when adding a user and click Generate new key.
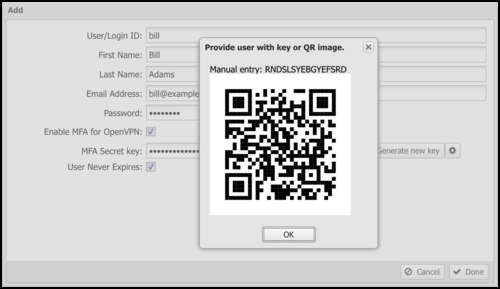
After generating a key, click the gear icon to show the QR code. Select key of the generated code in any TOTP mobile app, such as Google Authenticator. The TOTP app generates a temporary that the user enters into their OpenVPN client.
Local Directory
The Local Directory stores a list of users that the applications can use. It also supports RADIUS for 802.1x authentication from properly configured wireless network access points.
The RADIUS Server can be enabled to allow WiFi users to authenticate as any user configured in the Local Directory.
Report Viewer
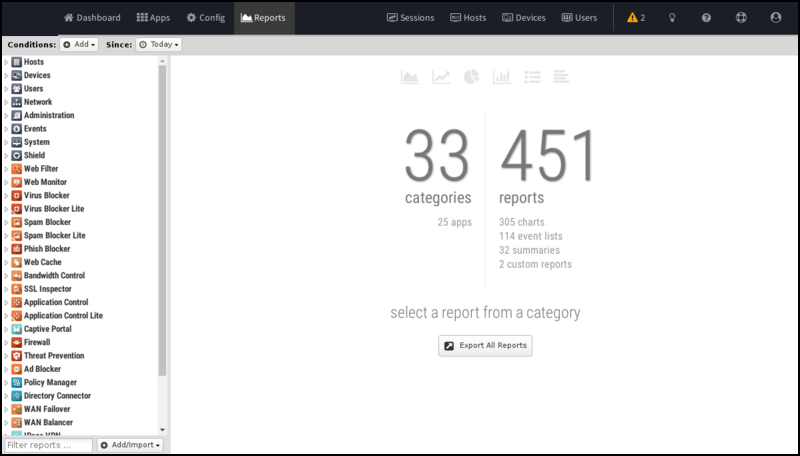
Reports provide a graphical view of your NG firewall's network traffic and actions. Various reports are available within applications and base system components. The Report Viewer allows you to manipulate the reports to drill down, customize, and export data in many ways.
Reports
Report Viewer Panels
- The top panel: This panel (below the navigation menu) allows you to specify which data is viewed. By default, there is a time frame and no conditions, so reports will show all the data for the specified time frame. Conditions can be viewed to view more specific data, such as a specific host, user, domain, application, web category, etc.
- The left panel: This allows you to choose the report you want to view. At the bottom, you can quickly use the search box to find reports with the specified string in the title. You can also import and create new reports using the Add/Import button.
- The chart panel: This panel shows the specified report and includes several action buttons at the top.
- The data panel: The data panel, hidden by default, can be displayed by clicking the Data View button in the chart panel. This will show the raw data used to generate the chart and allow the user to export the data by clicking the Export Data button at the bottom.
Conditions
The Conditions panel appears at the top panel and can filter data displayed in reports. For example, to view a specific host's report, you can add a condition for Client = 192.168.1.100, and then all reports available will only show data where the client is 192.168.1.100. Multiple conditions can be added to drill down and inspect data. Conditions can also be added quickly by clicking on slices in pie charts.
The Add Condition drop-down contains many commonly used conditions, or you can browse the full list of tables and columns by clicking on the More button to add conditions for any database column.
Condition Operators
The second field in the condition is the logical operator that will evaluate the condition value defined in the last field. In most use cases, the default = operator is what you want to use. However, several other operators are available that make the reports and alerts much more powerful.
Conditions Example - Policy by Policy ID
- In the Conditions panel, select Add.
- Choose Policy ID and specify equals and the policy ID in question.
- The conditions are applied and will remain applied as you switch between reports.
Conditions Example - Web Filter Categories
- Open Report Viewer or the Web Filter Reports tab.
- Select the Top Categories report (by size or requests). In our example, Games were at the top.
- Click the Games pie slice, and when prompted to add a condition, click Yes.
- All reports can now be viewed for Games-only traffic.
- For example, the Top Clients (by request) will show the clients that visited the most gaming sites.
- For example, the web usage (scanned) will show gaming web usage throughout the network day.


