Arista Analytics Basic Operations
Overview
Arista Analytics provides a non-proprietary extensible UI that integrates DMF Recorder Nodes, DMF Service Nodes, and the DANZ Monitoring Fabric controlled using an SDN Controller. The system has an extensive library of visualization components and analytics to compose new dashboards and answer further questions as they arise. The Arista Analytics node/cluster answers questions that would otherwise require specialized applications, such as Application Data Management (ADM) or Intrusion Protection Management (IPM). The Analytics node/cluster creates a document for each packet received. It adds metadata regarding the context, including the time and the receiving interface, which ElasticSearch can use to search the resulting documents quickly and efficiently.
Flows Dashboard
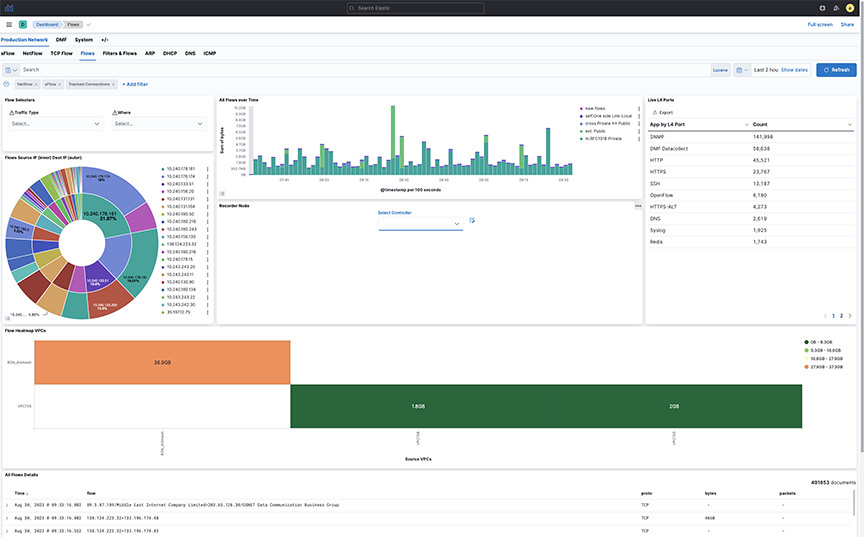
- Fabric: The home page for Analytics provides a series of tabs and sub-tabs.
- Controller: Opens the DANZ Monitoring Fabric GUI on the Controller identified using the option.
- Discover: Use predefined indices to filter and display specific events.
- Visualize: Customize the graphics displays provided by Arista Analytics.
- Dashboard: Displays dashboards for DANZ Monitoring Fabric events.
- Timelion: Displays events and other results according to time series.
The Kibana documentation documents the Analytics GUI, and most of its features and operations based on ElasticSearch are available at the following URL:
https://www.elastic.co/guide/en/kibana/7.2/index.html
Kibana 7.2 is the version used for Arista Analytics version 7.3.
Arista Analytics Fabric View
- Production Network: View information about the production network.
- DMF Network: View information about the monitoring network.
- System: Manage system configuration settings.
Each page contains panels with different functions and features. The network panels provide visualizations, such as pie charts, line graphs, or other graphic displays that reflect the current dashboard contents based on the specific query. The bottom panel lists all the events that match the current query. A pop-up window provides additional details about the selection when mousing over a panel.
Using Two-ring (by Production Switch) Pie Charts
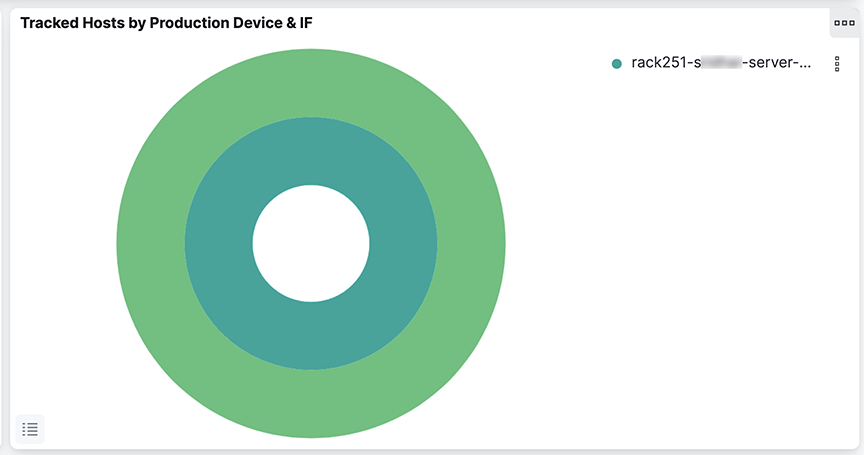
When a second ring appears in a pie chart, click any segment in the inner ring, and the outer ring provides a summary of information about the selected segment.
For example, in the Tracked Hosts by Production Device & IF pie chart , the outer ring shows hosts tracked on each interface, while the inner ring summarizes the tracked hosts on each switch. Clicking on a segment for a specific switch on the inner ring filters the outer ring to show the tracked hosts for the interfaces on the selected switch.
Filtering Information on a Dashboard
Filter the events displayed on a dashboard by choosing an area on the dashboard. This action limits the information displayed on the dashboard to events similar to those selected. Click any pie chart slice to limit the display to the specific activity chosen. To change the color assigned to a specific protocol or other object, click the label on the list to the right of the chart.
Selecting the Time Range
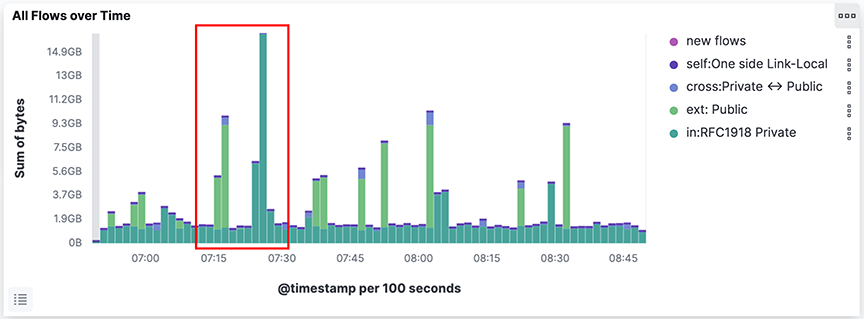
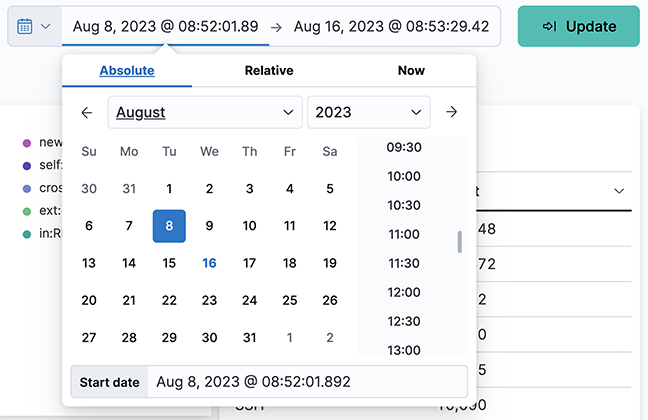
- Quick: Simple settings, such as Today, Last 1 hour, etc.
- Relative: Time offsets from a specific time, including the current time.
- Absolute: Set a range based on date and time.
- Recent: Provides a list of recently used ranges that you can reuse.
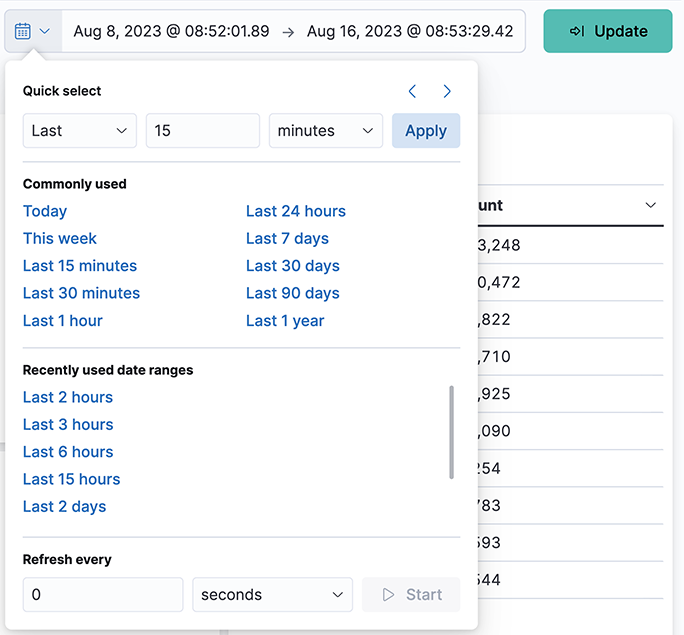
Select the refresh interval from the options provided. Click Start to disable the auto-refresh function.
Using the Search Field

- Enable/Disable filter
- Pin/Unpin filter
- Exclude/Include matches
- Remove filter
- Edit filter
The Action option in the upper right corner applies these actions to all the currently applied filters.
Click a segment on a pie chart for the appropriate filter; it automatically inserts into the Search field. To undo the filter, click the Remove filter icon.
- IP address
- Host name (requires DNS services)
- Protocol, for example, HTTP, HTTPS, ICMP, and so forth
- DMF interface name
To define complex queries using field names, which can be seen by scrolling and clicking on an event row. For example, on the sFlow®* dashboard, the query proto : TCP AND tags : ext displays all externally bound TCP traffic. OR NOT ( ) are also permitted in the expression. For more details about the supported search syntax, refer to the following URL:https://www.elastic.co/guide/en/elasticsearch/reference/current/query-dsl-query-string-query.html#query-string-syntax.
Search Performance Limitations
Refrain from executing a general query for 7 or 30 days. You should select a 7 or 30-day query with specific criteria, like querying a specific flow, filter interface, or DNS server.
To query NetFlow or sFlow for more extended periods, use the FLOW dashboard to determine the trend and then do a specific query, such as querying a specific flow or time, on the Netflow or sFlow dashboard.
For a great deal of NetFlow traffic, select one Analytics node only for NetFlow and another for other Analytics traffic.
Using Discover Mode
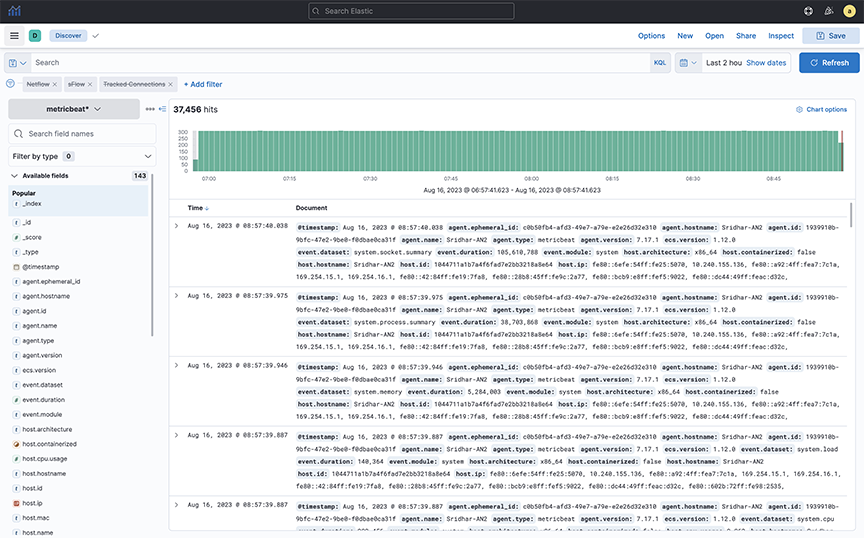
Use Discover mode to see the indices in the ElasticSearch database and identify the available data.
Managing Dashboards
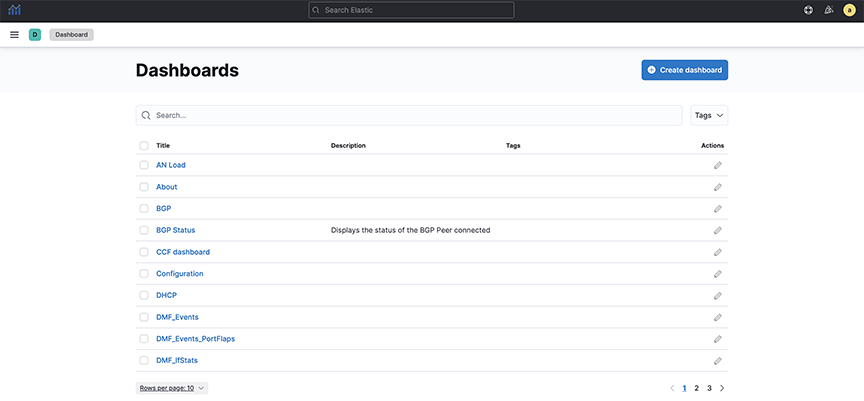
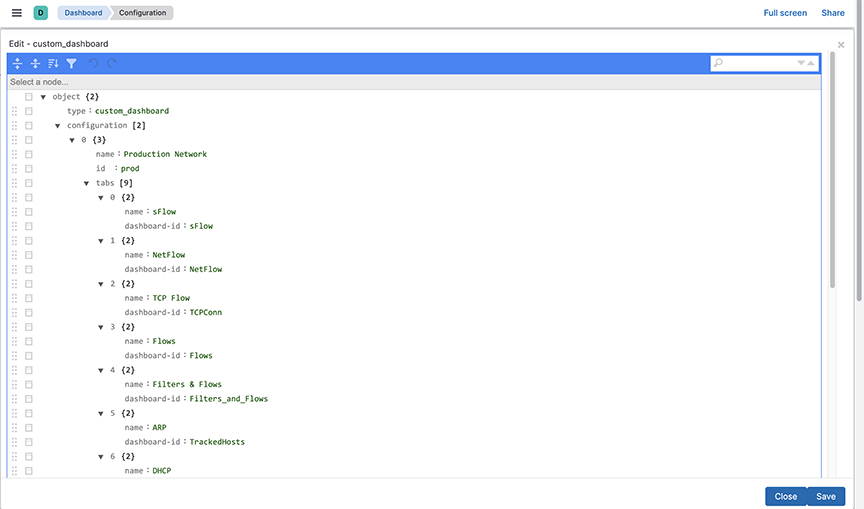
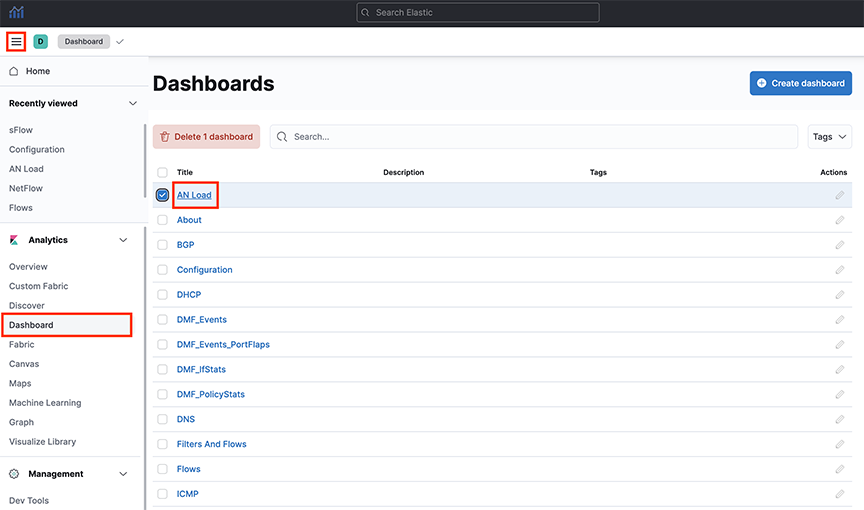
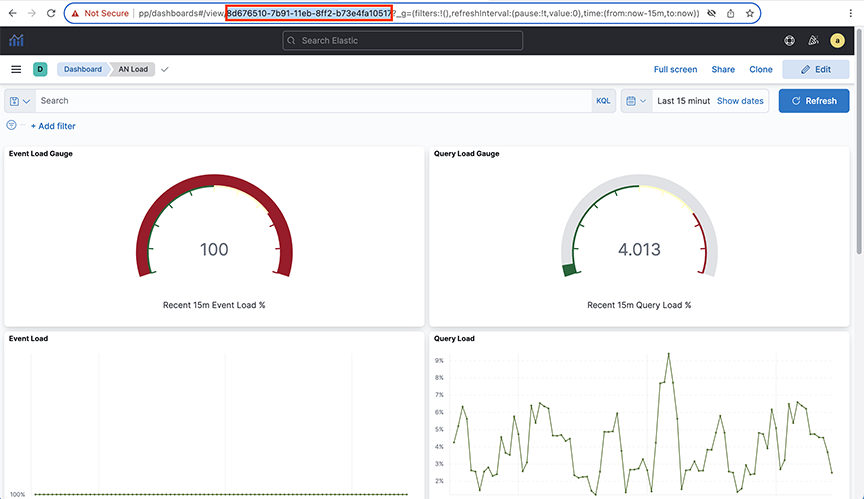
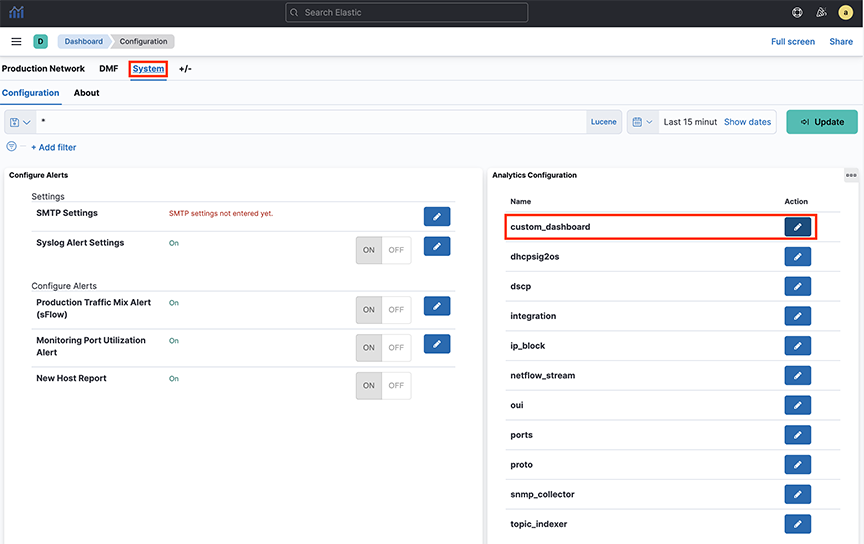
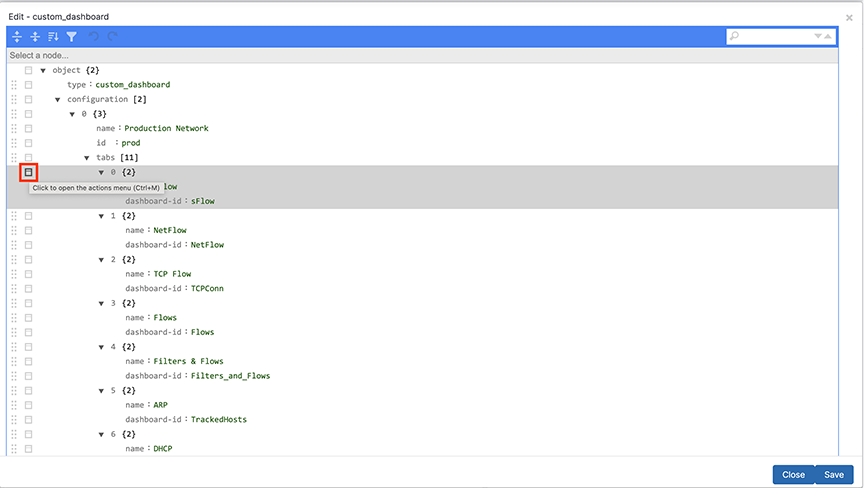
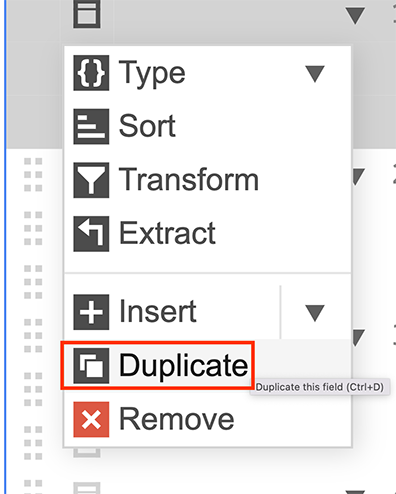
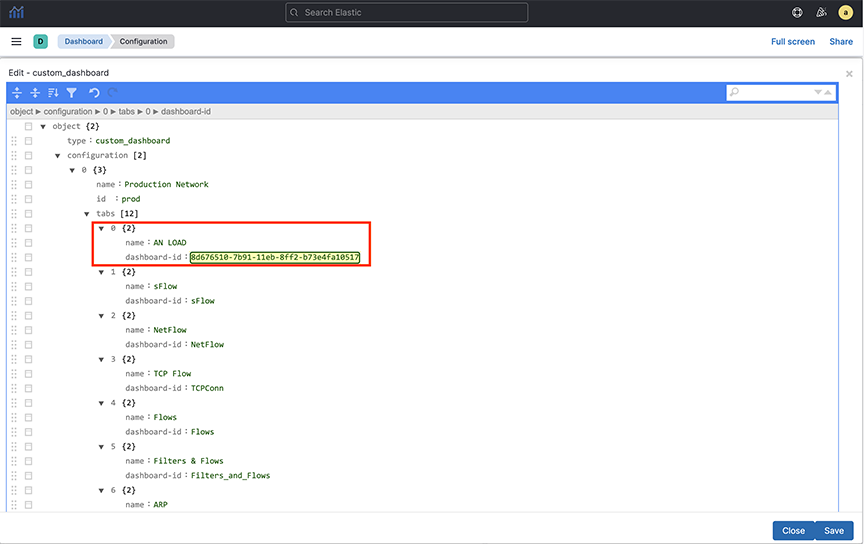
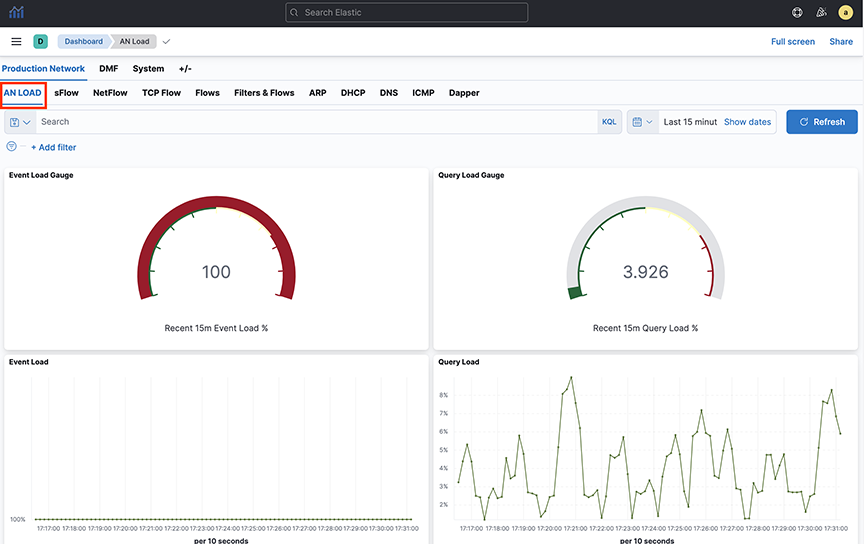
Custom Dashboards

Mapping IP Address Blocks
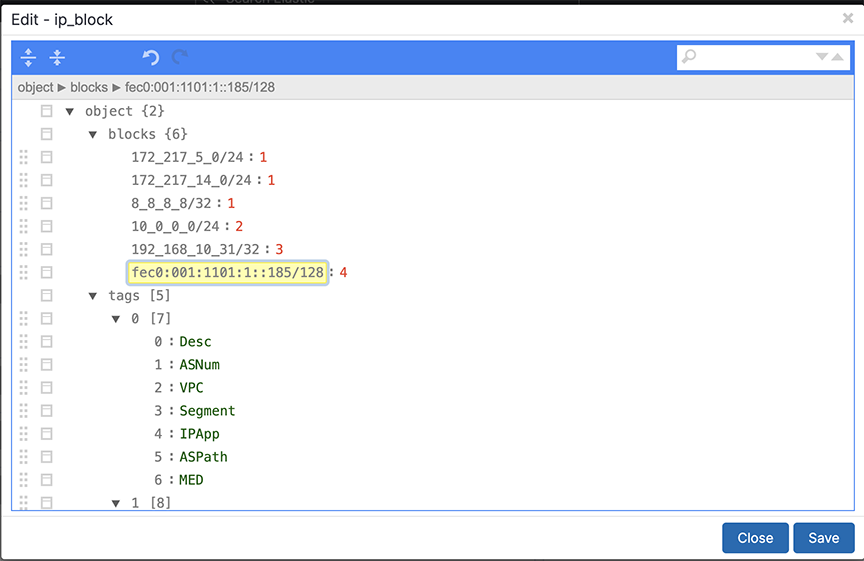
Complete the following steps to assign a single IP address or a block of IP addresses to a tool, group, or organization.
Mapping DHCP to OS
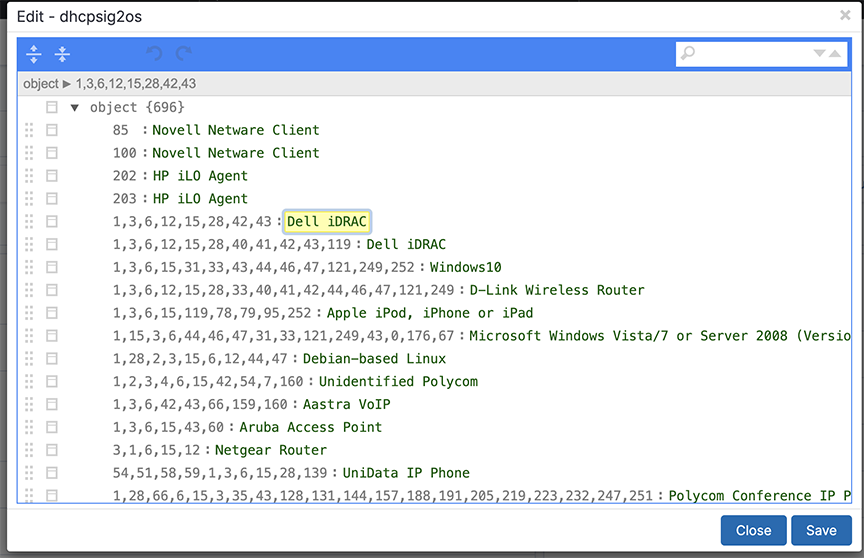
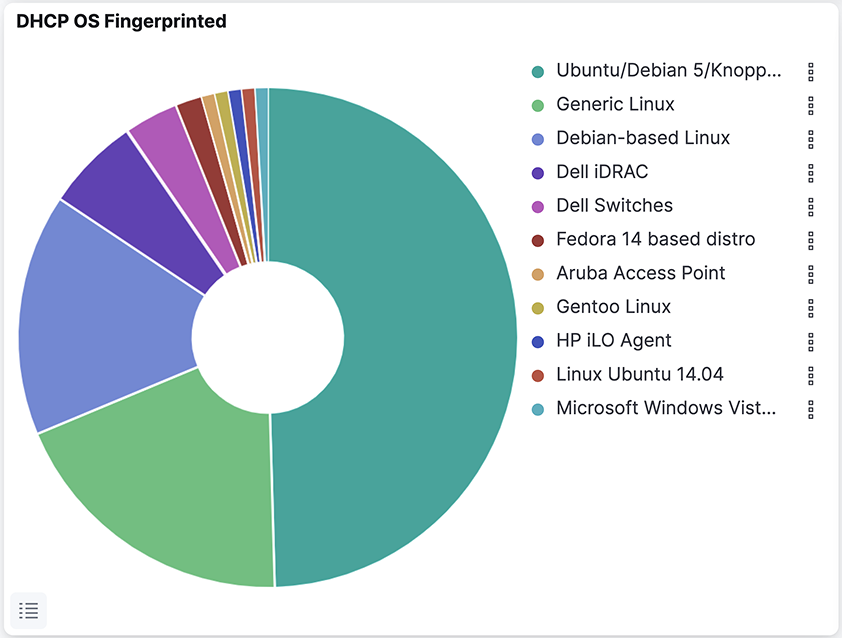
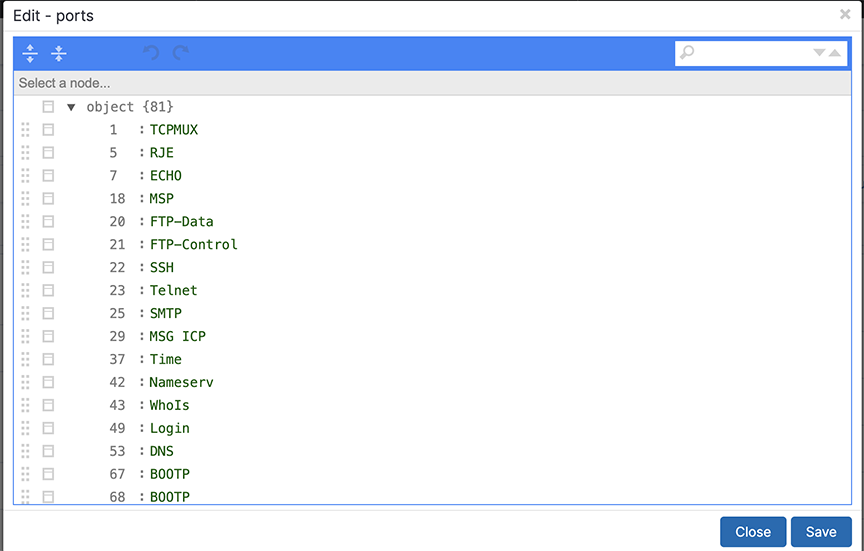
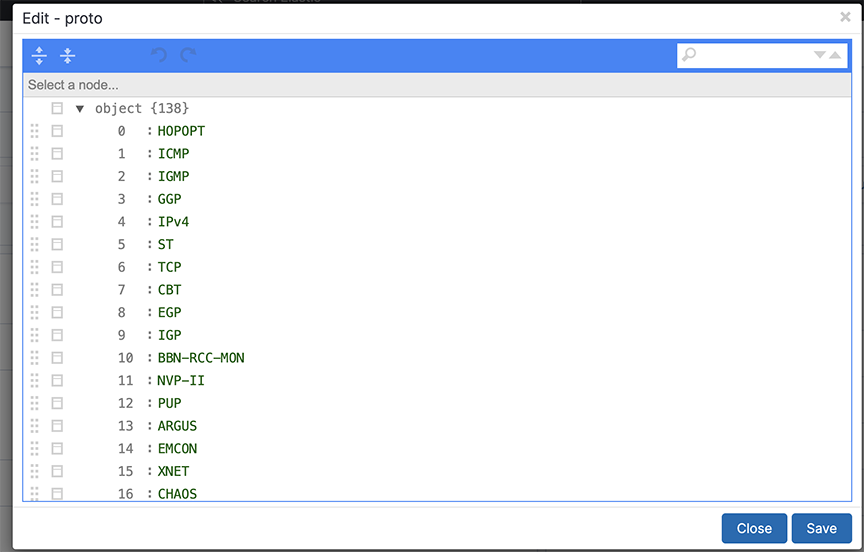
Mapping Ports and Protocols
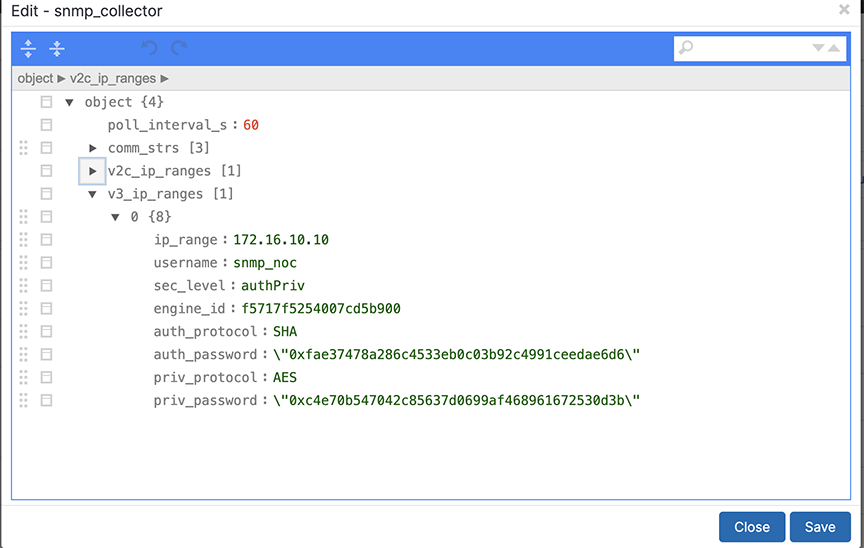
SNMP Collector
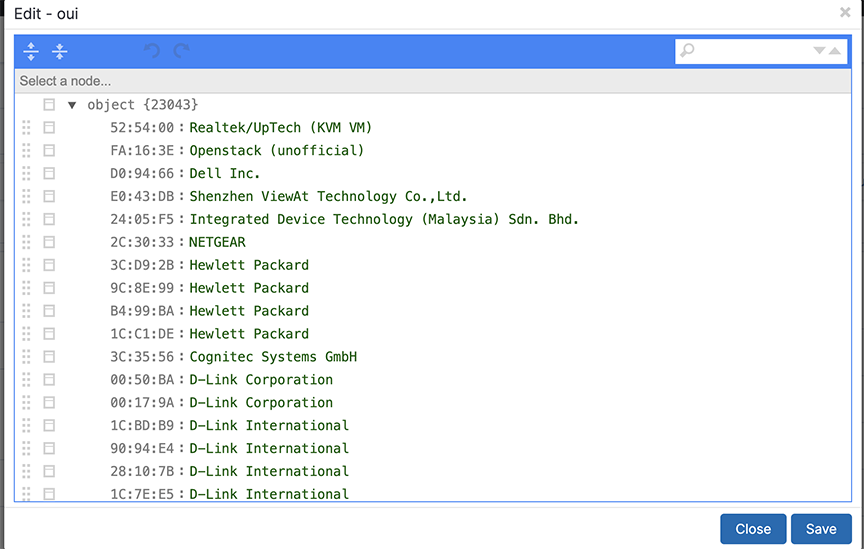
Mapping OUI to Hardware
Topic Indexer on Arista Analytics
Description
The Analytics Node (AN) incorporates a feature known as topic_indexer, designed to facilitate data ingestion from customer Kafka topics and its subsequent storage into Elasticsearch indices.
This process involves modifying field names and specifying the supported timestamp field during the ingestion phase. The renaming of field names enables the creation of dashboards used to visualize data across multiple streams, including DNS and Netflow.
The resulting indices can then be leveraged as searchable indices within the Kibana user interface, providing customers with enhanced search capabilities.
- Configure a stream job using topic_indexer. Access the setting via the Kibana dashboard in the analytics node.
- Locate the topic_indexer configuration on the Fabric Dashboard: , as shown in the following screenshots.
-
Figure 26. Analytics > Fabric 
- Another view:
Figure 27. System > Analytics Configuration 
- The design section shows the configuration for a topic
-
Figure 28. Node selection 
- To perform the topic_indexer configuration, select the page and open the Analytics Configuration panel:
Figure 29. System > Configuration 
-
Figure 30. Topic_indexer configuration 
Field Details
- topic: Kafka topic name; type string and is a mandatory field.
- broker_address: Broker address(es), this is of type array; this will be of format [IPv4|hostname:Port number] and is a mandatory field.
- consumer_group: This is an optional field; however, there is always a consumer group if not specified explicitly in the configuration. It is topic_name + index_name. Setting this field is particularly useful when ingesting multi-partitioned topics from the client's end.
- index: A dedicated index name for the topic; type string. In Elastic Search (ES), it is created as topic_indexer_<index_name> and is a mandatory field.
- field_group: An optional JSON field mapping to specify any column rename/format transformations. It specifies format for modifications to incoming data.
- type: To set timestamp field as the type.
- source_key: The source field name in the incoming data.
- indexed_key: The name of the destination field inserted in the outgoing ES index.
The indexed_key may be a @timestamp field of an ES index. If you do not specify a @timestamp field, topic_indexer automatically picks the time the message was received as the @timestamp of that message.
- format: Data format for the field (ISO8601).
Standards and Requirements
Input fields naming convention:
- Kafka allows all ASCII Alphanumeric characters, periods, underscores, and hyphens to name the topic. Intopic_indexer, legal characters include: a-z0-9\\._\\-
- Note that the only restriction topic_indexer has is on capitalizing topic names. topic_indexer does not support case-sensitive names. By default, topic_indexer treats the name as a lowercase topic. Hence, topic names should be lowercase only.
- All numeric names are also invalid field text.
Examples of names:
- my-topic-name
- my_topic_name
- itlabs.mytopic.name
- topic123
- 123topic
- my-index-name
- myTopicName
- ITLabs-Website-Tracker
- 12435
- MY-Index-name
- A broker address in Kafka comprises two values: IPv4 address and Port Number.
- When entering the broker address, use the format: IPv4:PORT.
Application Scenario
Querying Across DataStream using runtime-fields
POST <stream-name>/_rollover - Cross-index visualization - two data streams that need cross-querying:
-
Figure 31. Cross index visualization 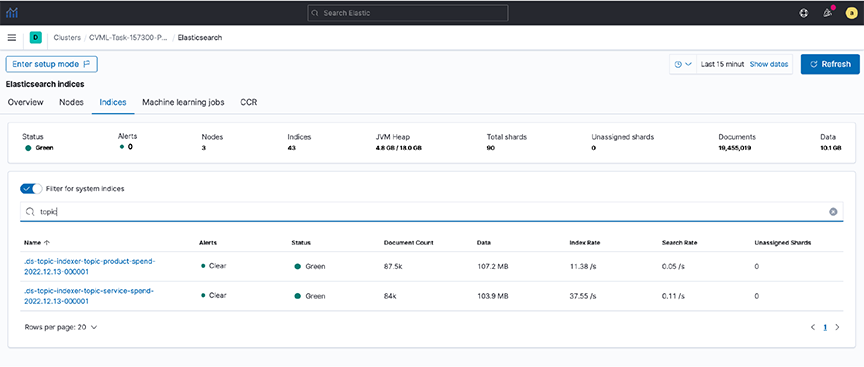
- Step 1. To view the documents in these indexes, create an index pattern (e.g., topic*spend) in Kibana.
- Step 2. View the data in the Discover dashboard.
Figure 32. Discover dashboard 
- Step 3. Create a common field (runtime field) between the two data streams by applying an API in Dev Tools.
Figure 33. Dev Tools 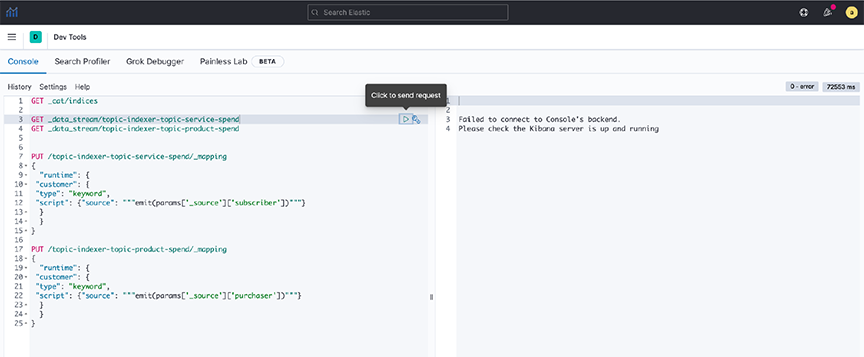 Note: Setting rollover policy on runtime fields can also be done in Dev Tools, as shown in the following examples:
POST /topic-indexer-service-spend/_rollover
POST /topic-indexer-product-spend/_rollover
Note: These changes are not persistent. Reapply is a must after any restart of AN. - Step 4. Finally, create a visualization using this common field, for example, Customer. The illustration below shows the Top 5 customers with the highest spending across products and services.
Figure 34. Visualization 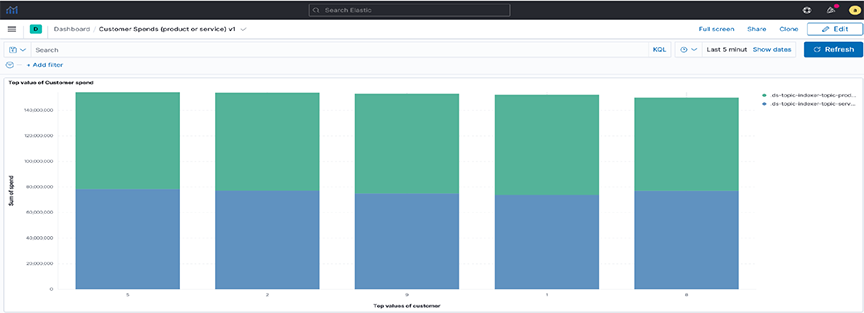
Syslog Messages
an> debug bash
admin@an$ cd /var/log/analytics/
admin@an:/var/log/analytics$
admin@an:/var/log/analytics$ ls -ls topic_indexer.log
67832 -rw-rwxr-- 1 remoteuser root 69453632 Apr 27 11:05 topic_indexer.log
Troubleshooting
- The Save button in the topic_indexer config is disabled.
When editing the configurations of topic_indexer in the Kibana User interface, default validations appear to ensure the correctness of the values entered in the fields. Specific standards and requirements are associated when filling in the config for topic_indexer as stated in the above section linked: Topic Indexer on Arista Analytics . As illustrated below, it may encounter validation errors when entering an invalid value in the configuration field. Topic Indexer on Arista Analytics
Figure 35. Validation errors 
In such an event, the edited configuration will not save. Therefore, before saving the configuration, validate the fields and ensure there is no visible validation error in the topic_indexer configuration editor.
- The index for the topic_indexer is not created.
After entering the correct fields in the topic_indexer configuration, the topic_indexer service will start to read the Kafka topic as documented in the configuration and load its data into the ElasticSearch index entered by the index field. The name of the index is prefixed by topic_indexer_.
There is a wait time of several minutes before the index is created and loaded with the data from the Kafka topic. In the event the index is not created, or there is no index shown with the name topic_indexer_<index_name> value, Arista Networks recommends using the following troubleshooting steps:- Check the configurations entered in the topic_indexer editor once again to see whether the spellings for the topic name, broker address configuration, and index name are correct.
- Verify the broker address and the port for the Kafka topic are open on the firewall. Kafka has a concept of listeners and advertised.listeners . Validate if the advertised.listeners are entered correctly into the configuration. Review the following links for more details:
- If all the above steps are correct, check now for the logs in the Analytics Node for the topic_indexer.
Steps to reach the topic_indexer.log file in AN node:
- Secure remote access into the AN using the command line: ssh <user>@<an-ip>
- Enter the password for the designated user.
- Enter the command debug bash to enter into debug mode.
- Use the sudo user role when entering the AN node: hence the sudo su command.
- topic_indexer logs reside in the following path: /var/log/analytics/topic_indexer.log
- Since this log file can be more extensive, you should use the tail command.
- Validate if the log file shows any visible errors related to the index not being created.
- Report any unknown issues.
- Data is not indexed as per the configuration.
- Data ingestion is paused.
When experiencing issues 3 or 4 (described above), use the topic_indexer log file to validate the problem.
- The index pattern for the topic_indexer is missing.
In the Kibana UI, it creates a default topic_indexer_* index pattern. If this pattern or a pattern to fetch the dedicated index for a topic is missing, create it using the Kibana UI as described in the following link:

