Events and Alerts
Managing Tasks in the ETM Dashboard
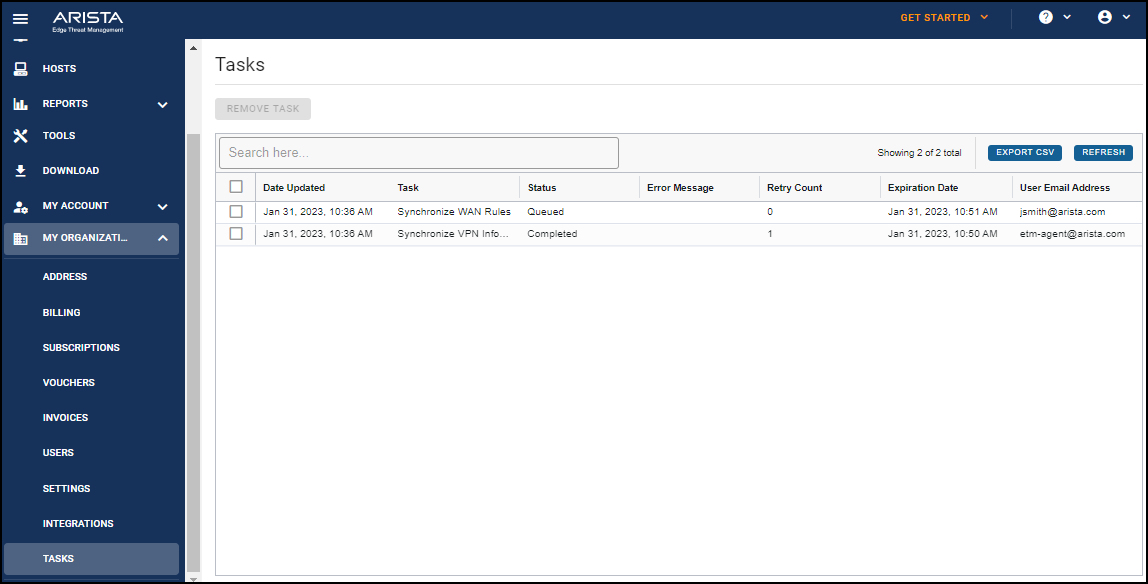
Centralized management through the ETM Dashboard allows the admin to push various configuration items to their appliances directly from the ETM Dashboard: backup configs, software-defined networks and VPN connections, application policies, and more. The Tasks feature enables the admin to view those pushes in one listing.
Viewing Tasks
This view displays information about pushes initiated from the ETM Dashboard.
| Column | Description |
|---|---|
| Date Updated | The date and time the task was initiated. |
| Task | A description of the task. |
| Status | The current state of the task: queued, error, or completed. |
| Error Message | If an error is encountered, the message will be displayed here. |
| Retry Count | The number of times the task has automatically retried to complete. |
| Expiration Date | The time at which ETM Dashboard will stop automatically retrying in the event of failures. |
| User Email Address | The email address of the ETM Dashboard login that initiated the task. |
Removing Tasks
To remove a task from the list, select it and click the Remove Task button.
Any task in "queued" or "error" status will be canceled, preventing attempts to complete the push. Completed tasks are only removed from the listing.
Viewing Events in the ETM Dashboard
You can view event logs in the Alerts section of the ETM Dashboard. The logs include:
- Audits
- Alerts
- Notifications
Audit History
The Audit History reports ETM Dashboard activities such as logins or appliance configuration changes. This is useful, for example, if you allow other users to manage appliances in your account and you need to audit their activities.
Alerts Received
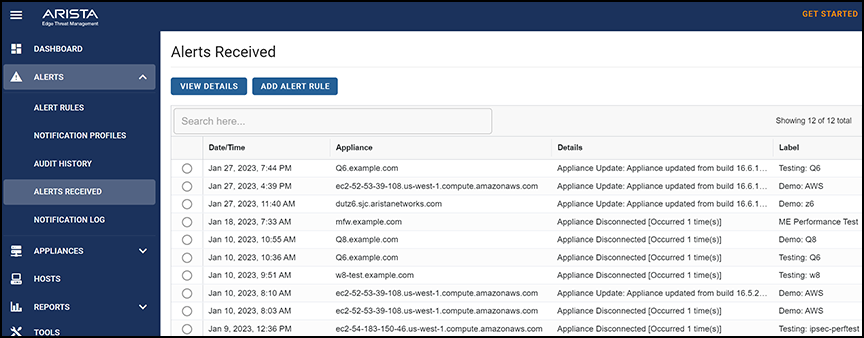
The Alerts Received log reports activities from Edge Threat Management appliances connected to your account. For example, when an appliance disconnected or upgraded automatically.
Alerts provide important information that may require immediate attention. Therefore, you can create rules to receive alerts to your email, Slack, or Arista Go app. More details are available in Managing Alert Rules.
Notification Log
The Notification Log reports when each alert message and via which notification profile. This is useful to confirm whether your account is sending alerts and if they are delivered successfully.
Managing Alert Rules
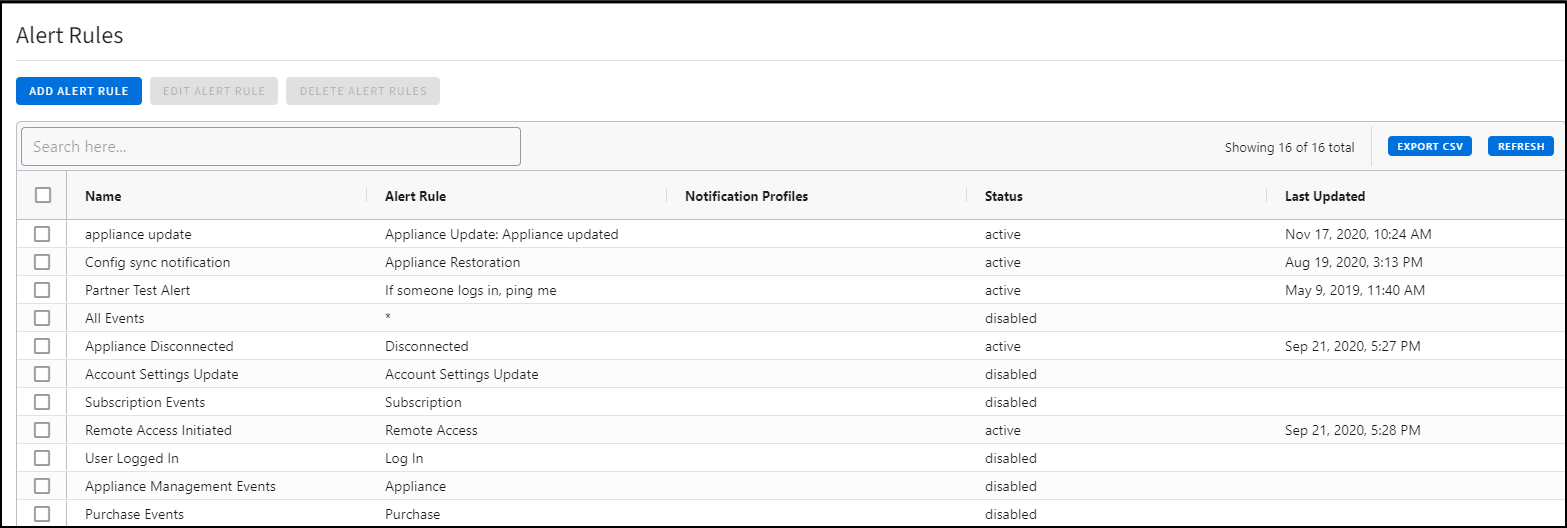
Your ETM Dashboard account includes several default alert rules to notify you about important events related to your appliances, subscriptions, and account. For example, an Alert Rule can trigger a notification when an appliance in your account goes offline or when an infected computer is discovered on the network.
Managing Alerts
- Log in to the ETM Dashboard.
- Click the Alerts tab at the top of the screen.
- Click Alert Rules from the menu on the left pane.
Enabling Default Rules
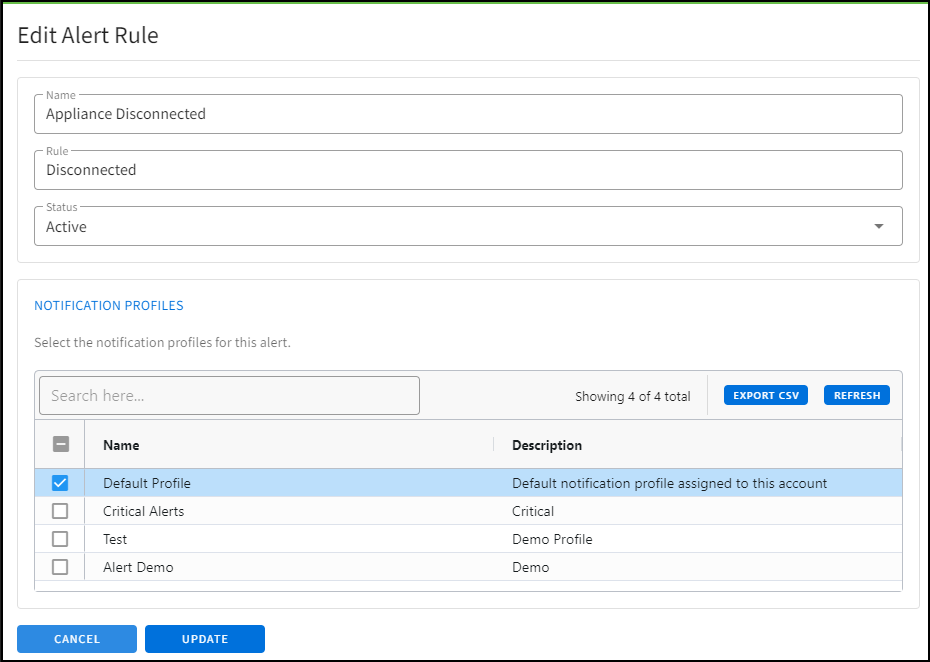
- Select a rule and click the Edit Alert Rule button.
- Set the rule status to Active.
- Confirm that your preferred notification profile is set and click Update.
Adding an Alert Rule
You can add alert rules by creating an alert rule from an event, or you can add an alert rule manually.
- Click Add Alert Rule.
- Enter a Name for the rule.
- Specify the Rule. This is the text string the Alert Rule will look for to trigger the Alert. You can view some example text strings under the Events report in the Command Center. Alternatively, entering "*" (without quotes) will trigger all events.
- Set the Status as Disabled or Active.
- Select your preferred notification profile and click Create.
Creating an Alert Rule from an Event
Alert rules are conditions based on events that trigger a notification. You can manually configure alert rules or create a rule from an event in the Audit History or Alerts Received.
Creating a Rule from an Event or Alert
- Log in to ETM Dashboard.
- Click the Alerts tab at the top of the screen.
- Click the Audit History or Alerts Received.
- Select an event from which you want to make a rule.

- Click Add Alert Rule.
- The view switches to the Create Alert Rule screen with the Rule populated by the event.
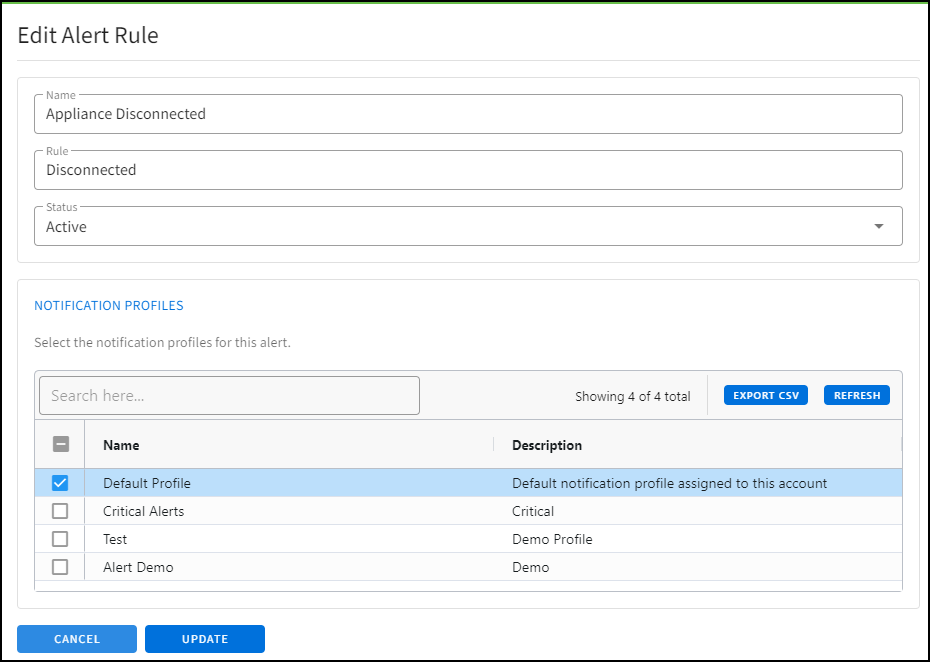
- Enter a Name for the rule.
- Confirm the Notification profile and click Create.
Managing Notification Profiles
The ETM Dashboard alert rules require a notification profile to send you alerts. The notification profile specifies how you want to receive alerts and how to present the information. You can manage notification profiles in .
Default Notification Profile
Your account in ETM Dashboard has a default notification profile that delivers alerts via email to the email address associated with your account. The default set of alert rules uses this profile to send you alerts.
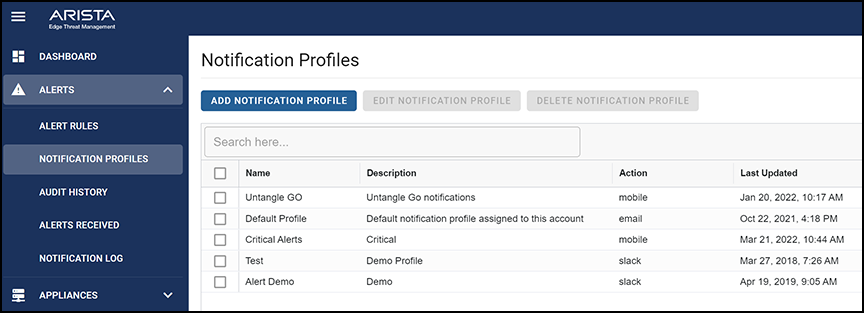
If you want to change how you receive alerts, you can edit this profile by selecting the profile and clicking Edit Notification Profile.
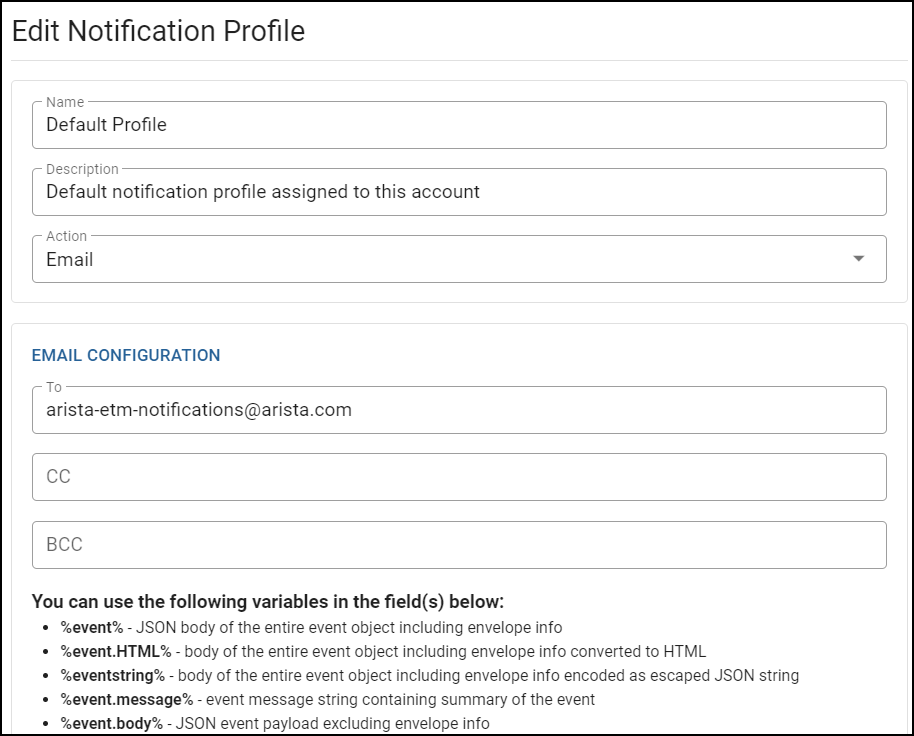
Notification Types
ETM Dashboard supports the following delivery services:
| Standard email delivery to the email address you specify. | |
| Slack | Delivery via a Slack webhook. |
| Pagerduty | Delivery via a Pagerduty webhook. |
| VictorOps | Delivery via a VictorOps webhook. |
| Webhook | Delivery via a custom webhook. |
| Arista Go (Mobile) | Delivery via Untangle Go mobile app. |
Adding a Notification Profile
Depending on the alert, you can add notification profiles to receive alerts to other addresses or types of delivery services. After you add a notification profile, you can configure alert rules to select the new profile.
- Click Add Notification Profile.
- Specify a name and description.
- Select an action to define how you want to receive the alert.
- For an Email action:
- Specify a From address and the To, CC, and BCC addresses separated by commas. Note that only the From and To addresses are required.
- Enter a Subject and Body. The table above these values provides variables you can use in the message. Refer to the default notification profile as a formatting guide.
- For a Slack action:
- Enter the endpoint URL of your app.
- For a Pagerduty action:
- Enter the routing key you designed for ETM Dashboard notifications.
- Select a severity level.
- For a VictorOps action:
- Enter the Endpoint URL you designate for ETM Dashboard notifications.
- Select a message type.
- For a Webhook action:
- Enter the Endpoint URL you designate for ETM Dashboard notifications.
- Click Add Header and enter a name and value if your custom integration requires custom headers.
- Select an HTTP Method.
- For a Mobile action:
- From the list under Mobile Configuration, select the Arista Go app in which you would like to receive notifications. You will see a list of all available devices if you have connected Arista Go from multiple mobile devices.

- From the list under Mobile Configuration, select the Arista Go app in which you would like to receive notifications. You will see a list of all available devices if you have connected Arista Go from multiple mobile devices.
- For an Email action:
- Click Create.
