Managing DMF Switches and Interfaces
This chapter describes the basic configuration required to deploy and manage DANZ Monitoring Fabric (DMF) switches and interfaces.
Overriding the Default Configuration for a Switch
- Info
- Clock
- SNMP
- SNMP traps
- Logging
- TACACS
- sFlow®*
- LAG enhanced hash
CLI Configuration
config-switch submode.
controller-1(config)# switch <switch-name>controller-1(config)# switch DMF-SWITCH-1
controller-1(config-switch)#From this submode, configure the specific switch and override the default configuration pushed from the DANZ Monitoring Fabric (DMF) Controller to the switch.
The DANZ Monitoring Fabric 8.6 Deployment Guide provides detailed instructions on overriding the switch's default configuration..
DMF Interfaces
- Filter interfaces: ports where traffic enters the DMF. Use filter interfaces to TAP or SPAN ports from production networks.
- Delivery interfaces: ports where traffic leaves the DMF. Use delivery interfaces to connect to troubleshooting, monitoring, and compliance tools. These include Network Performance Monitoring (NPM), Application Performance Monitoring (APM), data recorders, security (DDoS, Advanced Threat Protection, Intrusion Detection, etc.), and SLA measurement tools.
- Filter and delivery interfaces: ports with both incoming and outgoing traffic. When placing the port in loopback mode, use a filter and delivery interface to send outgoing traffic back into the switch for further processing. To reduce cost, use a filter and delivery interface when transmit and receive cables are connected to two separate devices.
- Service interfaces: interfaces connected to third-party services or network packet brokers, including any interface that sends or receives traffic to or from an NPB.
In addition, interfaces connected to managed service nodes and DANZ recorder nodes can be referenced in the configuration directly without assigning a role explicitly. Also, Inter-Switch Links (ISLs), which interconnect DANZ monitoring switches, are automatically detected and referred to as core interfaces.
Using the GUI to Configure a DMF Filter or Delivery Interface
Using the CLI to Configure a DANZ Filter or Delivery Interface
Using the CLI to Identify a Filter Interface using Destination MAC Rewrite
Global Configuration
Configure this function at the filter interface level and perform the following steps using the CLI.CLI Show Commands
The following show command displays the ingress flow for the filter switch.
In the Entry value column, the filter switch contains dst MAC tlv: EthDst(00:00:00:00:00:03).
(config-policy)# show switch filter1 table ingress-flow-2
# Ingress-flow-2 Device name Entry key Entry value
-|--------------|-----------|---------------------------------------|-----------------------------------|
1 0filter1 Priority(6400), Port(5), EthType(34525) Name(p1), Data([0, 0, 0, 61]), PushVlanOnIngress(flags=[]), VlanVid(0x1), Port(1), EthDst(00:00:00:00:00:03)
2 1filter1 Priority(6400), Port(5) Name(p1), Data([0, 0, 0, 62]), PushVlanOnIngress(flags=[]), VlanVid(0x1), Port(1), EthDst(00:00:00:00:00:03)
3 2filter1 Priority(36000), EthType(35020) Name(__System_LLDP_Flow_), Data([0, 0, 0, 56]), Port(controller), QueueId(0)
The core and delivery switch in the Entry value column doesn’t contain dst MAC tlv, as shown in the following examples.
(config-policy)# show switch core1 table ingress-flow-2
# Ingress-flow-2 Device name Entry key Entry value
-|--------------|-----------|-----------------------------------------------------|----------------------------|
1 0core1 Priority(6400), Port(1), EthType(34525), VlanVid(0x1) Name(p1), Data([0, 0, 0, 60]), Port(2)
2 1core1 Priority(6400), Port(1), VlanVid(0x1) Name(p1), Data([0, 0, 0, 59]), Port(2)
3 2core1 Priority(36000), EthType(35020) Name(__System_LLDP_Flow_), Data([0, 0, 0, 57]), Port(controller), QueueId(0)
(config-policy)# show switch delivery1 table ingress-flow-2
# Ingress-flow-2 Device name Entry key Entry value
-|--------------|-----------|-----------------------------------------------------|----------------------------|
1 0delivery1 Priority(6400), Port(1), EthType(34525), VlanVid(0x1) Name(p1), Data([0, 0, 0, 64]), Port(6)
2 1delivery1 Priority(6400), Port(1), VlanVid(0x1) Name(p1), Data([0, 0, 0, 63]), Port(6)
3 2delivery1 Priority(36000), EthType(35020) Name(__System_LLDP_Flow_), Data([0, 0, 0, 58]), Port(controller), QueueId(0)Troubleshooting
To troubleshoot the scenario where the provided destination MAC address is attached incorrectly to the filter interface. The ingress-flow-2 table above will have a destination MAC rewrite tlv on the filter switch, but no such tlv appears on the core or delivery switch.
As an alternative, drop into the bash of the filter switch to check the flow and destination MAC rewrite.
Use the following commands for the ZTN CLI of the filter switch.
(config)# connect switch filter1
(ztn-config) debug admin
filter1> enable
filter1# debug bash
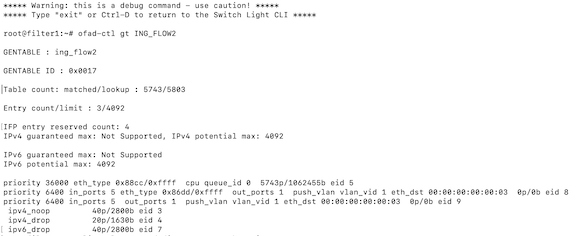
The following command prints the flow table of the filter switch.
root@filter1:~# ofad-ctl gt ING_FLOW2
(config)# show policy-flow
# Policy Name SwitchPkts Bytes PriT MatchInstructions
-|-----------|-----------------------------------|----|-----|----|-|------------------------|------------------|
1 p1core1 (00:00:52:54:00:15:94:88) 00 6400 1 eth-type ipv6,vlan-vid 1 apply: name=p1 output: max-length=65535, port=2
2 p1core1 (00:00:52:54:00:15:94:88) 00 6400 1 vlan-vid 1 apply: name=p1 output: max-length=65535, port=2
3 p1delivery1 (00:00:52:54:00:00:11:d2) 00 6400 1 vlan-vid 1 apply: name=p1 output: max-length=65535, port=6
4 p1delivery1 (00:00:52:54:00:00:11:d2) 00 6400 1 eth-type ipv6,vlan-vid 1 apply: name=p1 output: max-length=65535, port=6
5 p1filter1 (00:00:52:54:00:d5:2c:05) 00 6400 1apply: name=p1 push-vlan: ethertype=802.1Q (33024),set-field: match-field/type=vlan-vid, match-field/vlan-tag=1,output: max-length=65535, port=1,set-field: match-field/eth-address=00:00:00:00:00:03 (XEROX), match-field/type=eth-dst
6 p1filter1 (00:00:52:54:00:d5:2c:05) 00 6400 1 eth-type ipv6apply: name=p1 push-vlan: ethertype=802.1Q (33024),set-field: match-field/type=vlan-vid, match-field/vlan-tag=1,output: max-length=65535, port=1,set-field: match-field/eth-address=00:00:00:00:00:03 (XEROX), match-field/type=eth-dst
Considerations
- The destination MAC rewrite cannot be used on the filter interface where timestamping is enabled.
- The destination MAC rewrite will not work when the filter interface is configured as a receive-only tunnel interface.
Using the GUI to Identify a Filter Interface using Destination MAC Rewrite
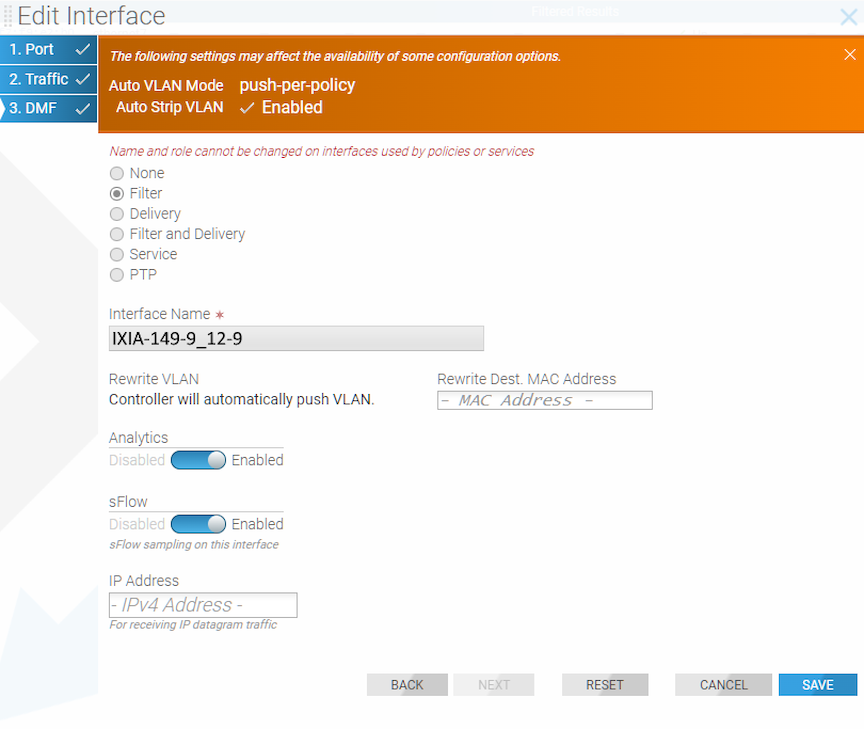
Workflow One
Using either the (or the ) page, proceed to the following workflow.
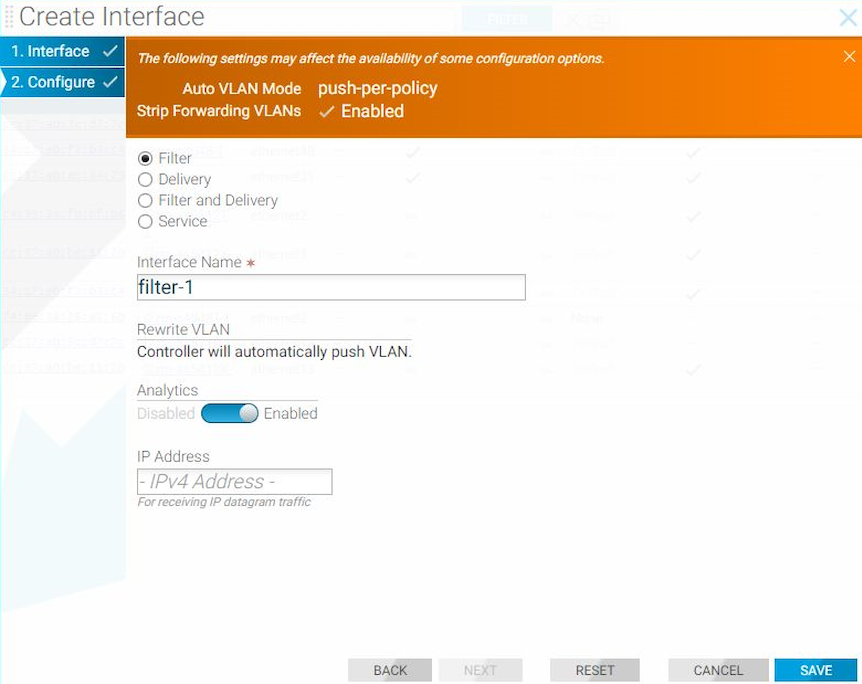
Create Interface
When using the page, use the following workflow.
Forward Slashes in Interface Names
DANZ Monitoring Fabric (DMF) supports using forward slashes (/) in interface names to aid in managing interfaces in the DMF fabric. For example, when:
- Defining the SPAN device name and port numbers which generally contain a forward slash (eth2/1/1) in the name for easy port identification.
- Using separate SPAN sessions for Tx and Rx traffic, when there are multiple links from a device to a filter switch.
|
|
|
|
|
|
|
|
|
|
|
|
|
Configuration
The configuration of DMF filter interfaces remains unchanged. This feature relaxes the existing naming convention by allowing a forward slash to be a part of the name.
The following are several examples:
both-filter-and-delivery, delivery, filter, ptp, service
dmf-controller-1(config-switch-if)# role role interface-name a/b/cdmf-controller-1(config)# filter-interface-group a/b/c
dmf-controller-1(config)# delivery-interface-group a/b/cdmf-controller-1(config-policy)# filter-interface f1/a/b
dmf-controller-1(config-policy)# filter-interface-group f/a/b
dmf-controller-1(config-policy)# delivery-interface d1/a/b
dmf-controller-1(config-policy)# delivery-interface-group d/a/bdmf-controller-1(config)# recorder-fabric interface a/b/cdmf-controller-1(config-managed-srv-flow-diff)# l3-delivery-interface a/b/cdmf-controller-1(config-mlag-domain)# mlag-interface a/b/c
dmf-controller-1(config-mlag-domain-if)# role delivery interface-name a/b/cdmf-controller-1(config-switch)# lag-interface a/b/cdmf-controller-1(config-switch)# gre-tunnel-interface a/b/cdmf-controller-1(config-switch)# vxlan-tunnel-interface a/b/cShow Commands
There are no new show commands. The existing show
running-config and show this commands for the configurations mentioned earlier should display the interface names without any issue.
Using Interface Groups
Create an interface group consisting of one or more filter or delivery interfaces. It is often easier to refer to an interface group when creating a policy than to identify every interface to which the policy applies explicitly.
Use an address group in multiple policies, referring to the IP address group by name in match rules. If no subnet mask is provided in the address group, it is assumed to be an exact match. For example, in an IPv4 address group, the absence of a mask implies a mask of /32. For an IPv6 address group, the absence of a mask implies a mask of /128.
Identify only a single IP address group for a specific policy match rule. Address lists with both src-ip and dst-ip options cannot exist in the same match rule.
Using the GUI to Configure Interface Groups
Using the CLI to Configure Interface Groups
controller-1(config-switch)# filter-interface-group TAP-PORT-GRP
controller-1(config-filter-interface-group)# filter-interface TAP-PORT-1
controller-1(config-filter-interface-group)# filter-interface TAP-PORT-2
controller-1(config-switch)# delivery-interface-group TOOL-PORT-GRP
controller-1(config-delivery-interface-group)# delivery-interface TOOL-PORT-1
controller-1(config-delivery-interface-group)# delivery-interface TOOL-PORT-2
To view information about the interface groups in the DMF fabric, enter the show filter-interface-group command, as in the following examples:
Filter Interface Groups
controller-1(config-filter-interface-group)# show filter-interface-group
! show filter-interface-group TAP-PORT-GRP
# Name Big Tap IF NameSwitch IF NameDirectionSpeed State VLANTag
-|------------|--------------------------|-----------------|----------|---------|-------|-----|--------|
1 TAP-PORT-GRP TAP-PORT-1 DMF-CORE-SWITCH-1 ethernet17rx 100Gbps up0
2 TAP-PORT-GRP TAP-PORT-2 DMF-CORE-SWITCH-1 ethernet18rx 100Gbps up0
controller1(config-filter-interface-group)#controller1(config-filter-interface-group)# show delivery-interface-group
! show delivery-interface-group DELIVERY-PORT-GRP
# NameBig Tap IF Name Switch IF NameDirectionSpeed Rate limit State Strip Forwarding Vlan
-|-----------------|---------------|---------------------|----------|---------|------|---------|-----|---------------------|
1 TOOL-PORT-GRP TOOL-PORT-1 DMF-DELIVERY-SWITCH-1 ethernet15 tx10Gbps upTrue
2 TOOL-PORT-GRP TOOL-PORT-2 DMF-DELIVERY-SWITCH-1 ethernet16 tx10Gbps upTrue
controller-1(config-filter-interface-group)#Switch Light CLI Operational Commands
As a result of upgrading the Debian distribution to Bookworm, the original Python CLI (based on python2) was removed, as the interaction with the DANZ Monitoring Fabric (DMF) is performed mainly from the Controller.
However, several user operations involve some of the commands used on the switch. These commands are implemented in the new CLI (based on python3) in Switch Light in the Bookworm Debian distribution.
The Zero-Trust Network (ZTN) Security CLI is the default shell when logged into the switch.
Operational Commands
After connecting to the switch and from the DMF Controller, use the debug admin command to enter the switch admin CLI from the ZTN CLI.
DMF-CONTROLLER# connect switch dmf-sw-7050sx3-1
Switch Light OS SWL-OS-DMF-8.6.x(0), 2024-05-16.08:26-17f56f6
Linux dmf-sw-7050sx3-1 4.19.296-OpenNetworkLinux #1 SMP Thu May 16 08:35:25 UTC 2024 x86_64
Last login: Tue May 21 10:39:05 2024 from 10.240.141.151

Switch Light ZTN Manual Configuration. Type help or ? to list commands.

(ztn-config) debug admin
(admin)
(admin) exit

(ztn-config)
Help
(admin) help

Documented commands (type help <topic>):
========================================
EOFcopyexithelppingping6quitrebootreloadshow
Ping
(admin) ping 10.240.141.151
PING 10.240.141.151 (10.240.141.151) 56(84) bytes of data.
64 bytes from 10.240.141.151: icmp_seq=1 ttl=64 time=0.238 ms
64 bytes from 10.240.141.151: icmp_seq=2 ttl=64 time=0.206 ms
64 bytes from 10.240.141.151: icmp_seq=3 ttl=64 time=0.221 ms
64 bytes from 10.240.141.151: icmp_seq=4 ttl=64 time=0.161 ms

--- 10.240.141.151 ping statistics ---
4 packets transmitted, 4 received, 0% packet loss, time 3049ms
rtt min/avg/max/mdev = 0.161/0.206/0.238/0.028 ms
Ping6
(admin) ping6 fe80::3673:5aff:fefb:9dec
PING fe80::3673:5aff:fefb:9dec(fe80::3673:5aff:fefb:9dec) 56 data bytes
64 bytes from fe80::3673:5aff:fefb:9dec%ma1: icmp_seq=1 ttl=64 time=0.490 ms
64 bytes from fe80::3673:5aff:fefb:9dec%ma1: icmp_seq=2 ttl=64 time=0.232 ms
64 bytes from fe80::3673:5aff:fefb:9dec%ma1: icmp_seq=3 ttl=64 time=0.218 ms
64 bytes from fe80::3673:5aff:fefb:9dec%ma1: icmp_seq=4 ttl=64 time=0.238 ms

--- fe80::3673:5aff:fefb:9dec ping statistics ---
4 packets transmitted, 4 received, 0% packet loss, time 3069ms
rtt min/avg/max/mdev = 0.218/0.294/0.490/0.113 ms
Copy Tech-Support Data
Use the copy tech-support data command to collect the switch support bundle. The tech support command executed from the Controller collects support bundles from all the switches in the fabric.
To collect tech support data for an individual switch, only run the copy tech-support data command from that switch. Perform this action when the switch isn't accessible from the Controller or when collecting a support bundle only for that switch.(admin) copy tech-support data
Writing /mnt/onl/data/tech-support_240521104337.txt.gz...
tech-support_240521104337.txt.gz created in /mnt/onl/data/
(admin)Show Commands
The following show commands are available under the admin shell.
(admin) show clock
Tue May 21 10:46:20 2024
(admin)(admin) show ntp
remote refid st t when pollreach delayoffset jitter
=======================================================================================================
10.130.234.12 .STEP.16 u- 10240 0.0000 0.0000 0.0002
*time2.google.com.GOOG. 1 u649 102437740.0469 1.6957 0.4640
+40.119.6.22825.66.230.13 u601 102437750.6083-0.5323 7.8069
(admin)Show Controller
(admin) show controller
IP:PortProto StateRole #Aux
10.240.141.151:6653tcp CONNECTEDACTIVE2
10.240.189.233:6653tcp CONNECTEDSTANDBY 2
 127.0.0.1:6653tcp CONNECTEDSTANDBY 1
(admin)history and statistics options in the show controller command to obtain additional information.
(admin) show controller history | statistics
(admin)(admin) show controller history
Mon May 20 15:53:42 2024 tcp:127.0.0.1:6653:0 - Connected
Mon May 20 15:53:43 2024 tcp:127.0.0.1:6653:1 - Connected
Mon May 20 15:54:46 2024 tcp:127.0.0.1:6653:1 - Disconnected
Mon May 20 15:54:46 2024 tcp:127.0.0.1:6653:0 - Disconnected
Mon May 20 08:57:07 2024 tcp:127.0.0.1:6653:0 - Connected
Mon May 20 08:57:07 2024 tcp:127.0.0.1:6653:1 - Connected
Mon May 20 08:57:07 2024 tcp:10.240.141.151:6653:0 - Connected
Mon May 20 08:57:07 2024 tcp:10.240.141.151:6653:1 - Connected
Mon May 20 08:57:07 2024 tcp:10.240.141.151:6653:2 - Connected
Mon May 20 11:16:07 2024 tcp:10.240.189.233:6653:0 - Connected
Mon May 20 11:16:19 2024 tcp:10.240.189.233:6653:1 - Connected
Mon May 20 11:16:19 2024 tcp:10.240.189.233:6653:2 - Connected
(admin)show controller statistics command displays connection statistics, including keep-alive timeout, timeout threshold count, and other important information, as shown in the following example.
(admin) show controller statistics
Connection statistics report
Outstanding async op count from previous connections: 0
Stats for connection tcp:10.240.141.151:6653:0:
Id: 131072
Auxiliary Id: 0
Controller Id: 0
State: Connected
Keepalive timeout: 2000 ms
Threshold: 3
Outstanding Echo Count: 0
Tx Echo Count: 46438
Messages in, current connection: 52887
Cumulative messages in: 52887
Messages out, current connection: 52961
Cumulative messages out: 52961
Dropped outgoing messages: 0
Outstanding Async Operations: 0
Stats for connection tcp:10.240.189.233:6653:0:
Id: 112066561
Auxiliary Id: 0
Controller Id: 1
State: Connected
Keepalive timeout: 2000 ms
Threshold: 3
Outstanding Echo Count: 0
Tx Echo Count: 42269
Messages in, current connection: 43108
Cumulative messages in: 43108
Messages out, current connection: 43114
Cumulative messages out: 43114
Dropped outgoing messages: 0
Outstanding Async Operations: 0
(admin)(admin) show log
2024-05-20T15:53:04+00:00 localhost syslog-ng[3787]: NOTICE syslog-ng starting up; version='3.38.1'
2024-05-20T15:52:51+00:00 localhost kernel: NOTICE Linux version 4.19.296-OpenNetworkLinux (bsn@sbs3) (gcc version 12.2.0 (Debian 12.2.0-14)) #1 SMP Thu May 16 08:35:25 UTC 2024
2024-05-20T15:52:51+00:00 localhost kernel: INFO Command line:reboot=p acpi=on Aboot=Aboot-norcal6-6.1.10-14653765 platform=magpie sid=Calpella console=ttyS0,9600n8 tsc=reliable pcie_ports=native pti=off reassign_prefmem amd_iommu=off onl_mnt=/dev/mmcblk0p1 quiet=1 onl_platform=x86-64-arista-7050sx3-48yc12-r0 onl_sku=DCS-7050SX3-48YC12
2024-05-20T15:52:51+00:00 localhost kernel: INFO BIOS-provided physical RAM map:
….
….
2024-05-21T10:40:31-07:00 dmf-sw-7050sx3-1 systemd[1]: INFO Starting logrotate.service - Rotate log files...
2024-05-21T10:40:32-07:00 dmf-sw-7050sx3-1 systemd[1]: INFO logrotate.service: Deactivated successfully.
2024-05-21T10:40:32-07:00 dmf-sw-7050sx3-1 systemd[1]: INFO Finished logrotate.service - Rotate log files.
2024-05-21T10:45:32-07:00 dmf-sw-7050sx3-1 systemd[1]: INFO Starting logrotate.service - Rotate log files...
2024-05-21T10:45:33-07:00 dmf-sw-7050sx3-1 systemd[1]: INFO logrotate.service: Deactivated successfully.
2024-05-21T10:45:33-07:00 dmf-sw-7050sx3-1 systemd[1]: INFO Finished logrotate.service - Rotate log files.
(admin)Reboot and Reload
(admin) help reboot

Reboot the switch.

(admin) help reload

Reload the switch.

(admin) reboot
Proceed with reboot [confirm]?

(admin) reload
Proceed with reload [confirm]?
(admin)


