Monitoring Users and Software Running on the Network
IP Addresses
This section describes identifying traffic transmitted or received by the source or destination IP address.
Source and Destination Addresses

The selected IP address is added to the filters on the dashboard.
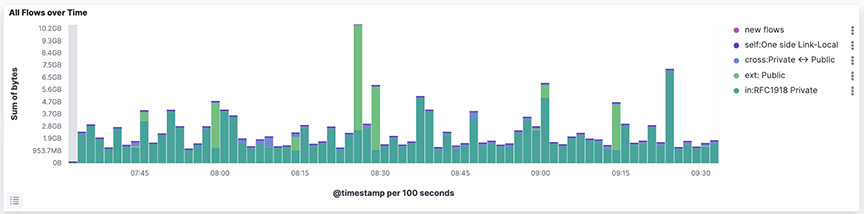
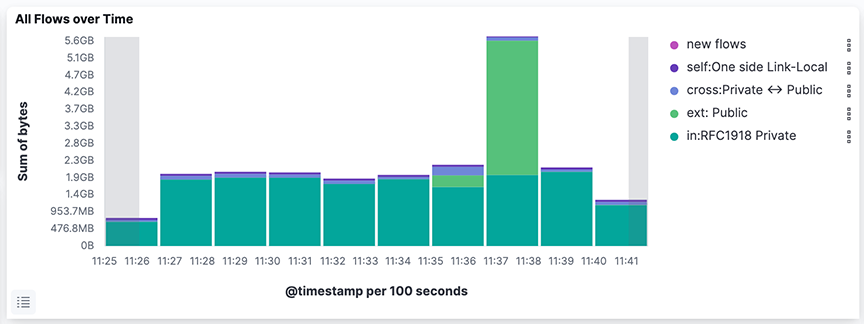
Each dashboard has a bar chart depicting traffic on the y-axis and time on the x-axis. To add a time filter, click and drag an area in the All Flows Over Time bar chart.
Unauthorized IP Destinations
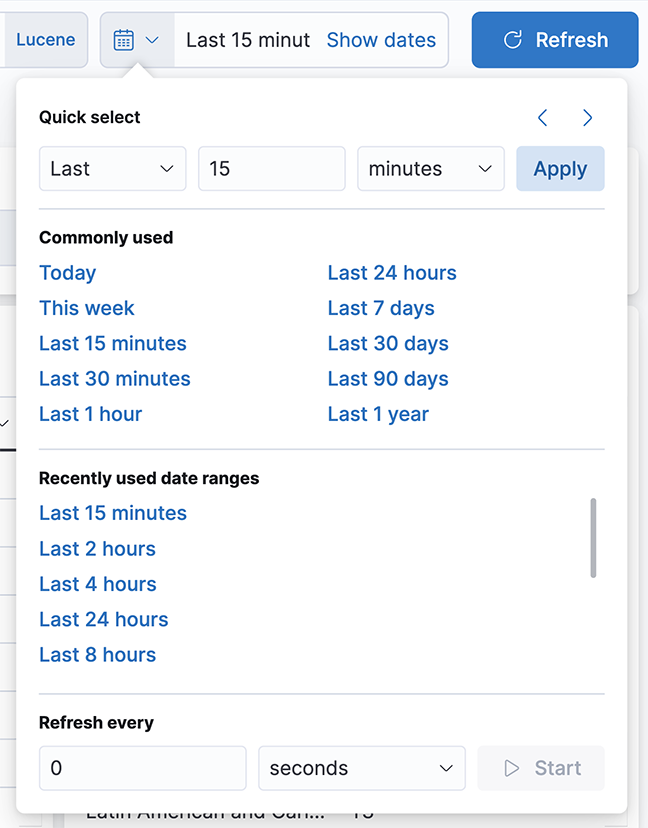
Select the duration of time for the search.
Type the IP address or the Network ID in the Search field.
The system displays any events associated with the address or network ID.
Geographic Location
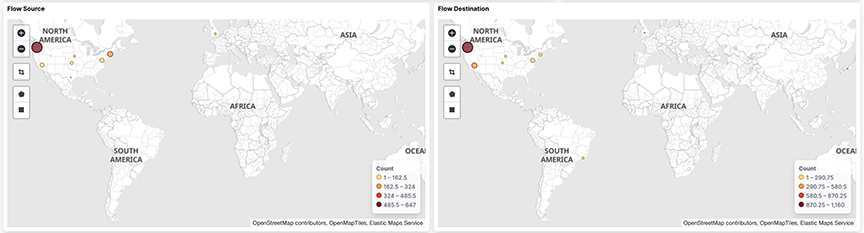
Use the Square tool to draw a square around a region of interest, or use the Polygon tool to draw an irregular shape around a region. It will redraw the mapto zoom in on the selected region and to show details about traffic to or from the region.
Software Running in the Network
This section identifies specific applications or operating systems running on network hosts.
Top Talkers Using Well-known Layer-4 Ports
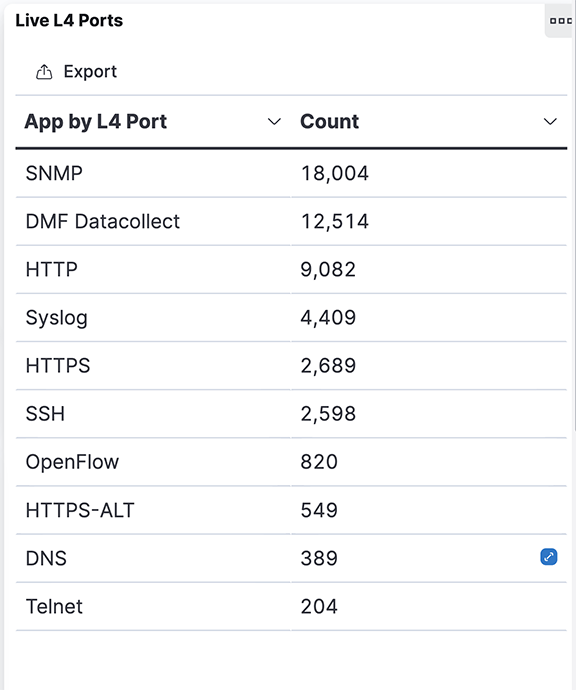
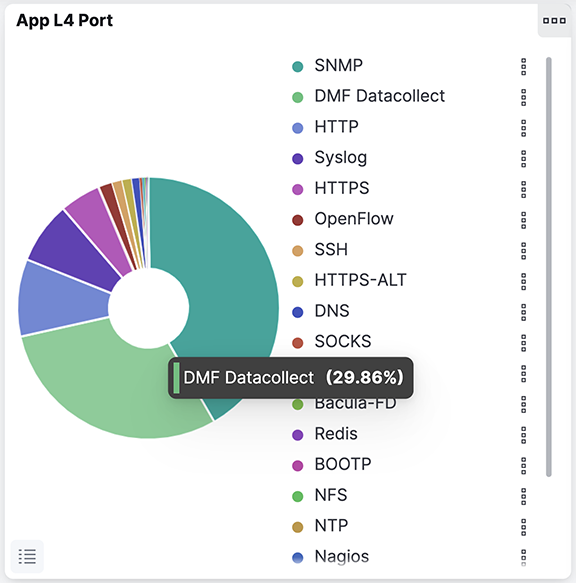
These tables use well-known ports to identify the traffic generated by each application. You can also associate user-defined ports with applications as described in the following section.
Associating Applications with User-defined Layer4 Ports
- Select the Edit control to the right of the Ports section.
Figure 7. Edit Ports 
- To copy an existing row, enable the checkbox to the left of the row and select Duplicate from the drop-down menu.
Figure 8. Duplicate Ports 
Software Running on Hosts
- Searching for well-known applications
- Using Layer4 labels
- Searching packet captures on the DMF Recorder Node
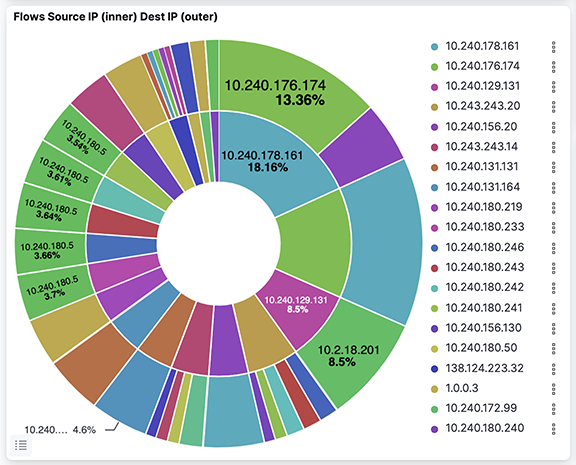
- Using the Flows dashboard
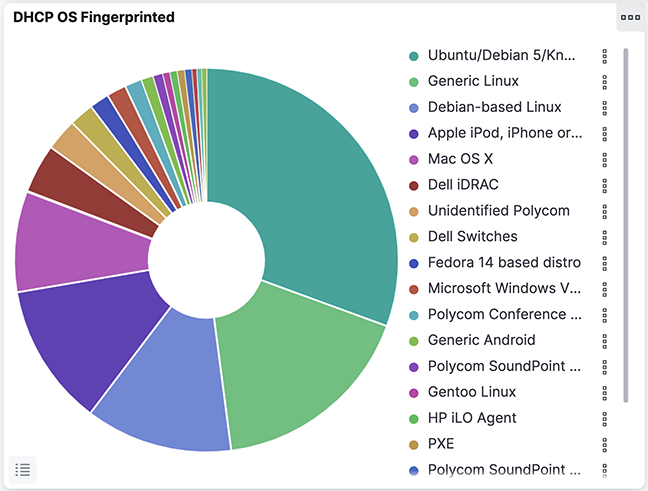
- Using the DHCP dashboard for information about operating systems
The IP block default mapping associates many common applications with specific address ranges. For example, you can identify video traffic by searching for YouTube or Netflix.
L4 label strings identify applications using well-known ports and applications running on user-defined ports after mapping those ports to the applications.
The flow dashboards all give an overall sense of who is talking to whom. Click on an IP address or L4 port, and with the + that appears, pin that to filter the dashboard by the selection. Every dashboard has a bar chart depicting traffic on the y-axis and time on the x-axis. Note that a time filter can be added by a click and sideways selection of the bar chart.
The who can also be in terms of the user with a source of users to IP mappings (OpenVPN supported) configured. After that, a search by the user string for traffic attributed to that user over a dashboard period.
Tools Receiving Traffic
Refer to the Mapping IP Address Blocks section for details about updating the IP block mapping file.
- To edit the IP blocks, select and click the Edit control to the right of the IP blocks section.
Figure 10. Mapping a Tool to an IP Address: IP Block Edit 
- Scroll down and add a tag definition with the same number as the IP block.
Figure 11. Mapping a Tool to an IP Address: Define Tags 
- Select .
To cross-reference the information you get by labeling an IP block with information about any policies configured to forward traffic to that IP address.
Figure 12. DMF Policies 
User Activity
This section identifies specific users transmitting or receiving traffic on the network.
User Sessions
- Flows dashboard
- sFlow dashboard
- NetFlow dashboard
- Open VPN or Active Directory mapping to IP address
It can also identify traffic associated with specific users after using the IP blocks configuration to map them to a specific IP address. Once saved, it can search for the user string to see traffic attributed to that user over the period displayed on the dashboard.
New Network Users
- Comparing the same dashboard for two different periods
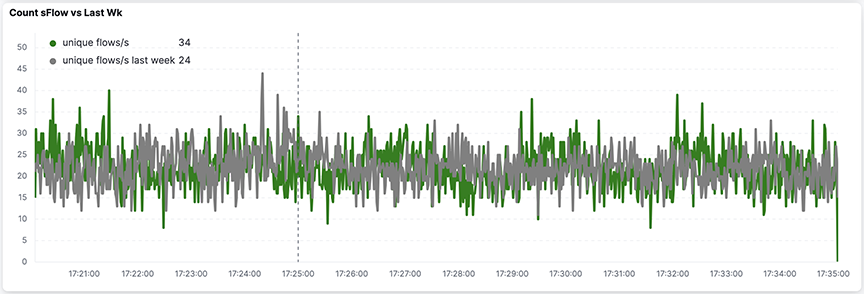
- sFlow > Count sFlow vs Last Wk
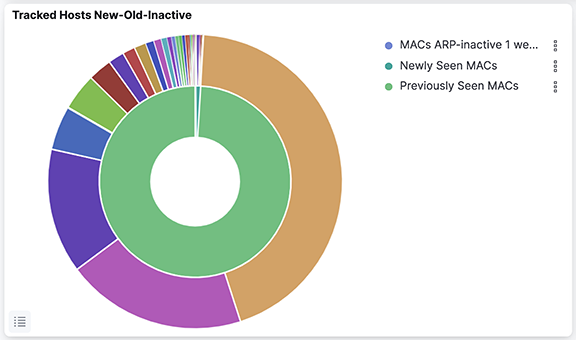
- ARP dashboard
- New Host Report