Monitoring Users and Software Running on the Network

This chapter describes using Arista Analytics with the DMF Recorder Node. It includes the following sections.

IP Addresses

This section describes identifying traffic transmitted or received by the source or destination IP address.

Source and Destination Addresses
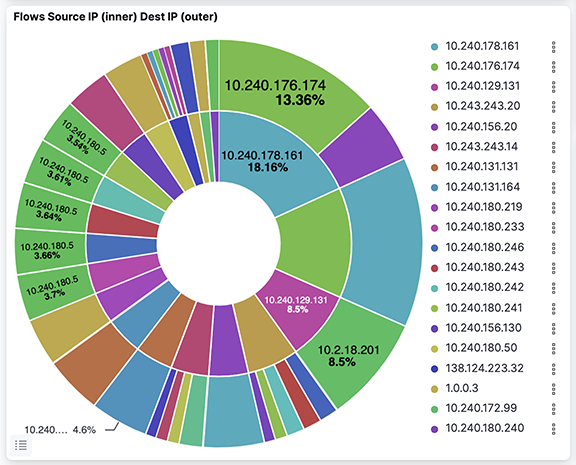
Figure 1. Identifying Source and Destination IP Addresses
Click an IP address, then click the Magnifying Glass icon (+) to pin the address to the dashboard.
Figure 2. Filtering Results by IP Address

The selected IP address is added to the filters on the dashboard.

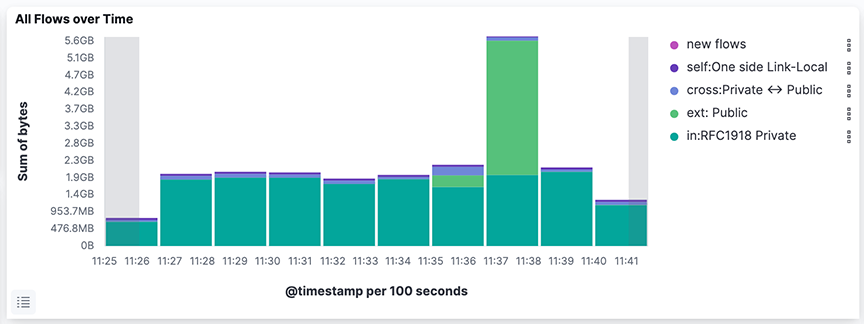
Each dashboard has a bar chart depicting traffic on the y-axis and time on the x-axis. To add a time filter, click and drag an area in the All Flows Over Time bar chart.

Unauthorized IP Destinations
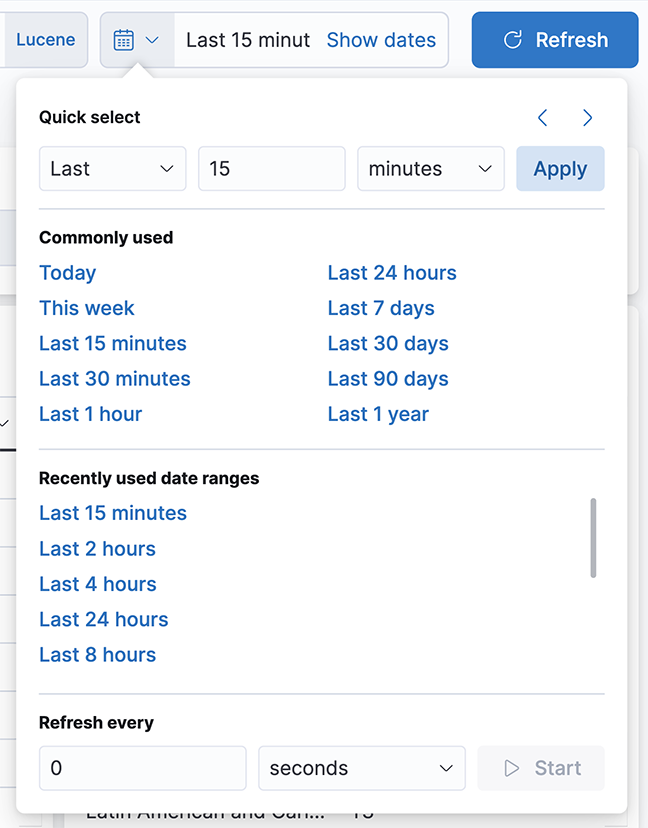
To determine if an IP destination that is not authorized is being accessed in your network for a specific period, set the time value in the upper right corner.
Figure 3. Setting the Duration

Select the duration of time for the search.

Type the IP address or the Network ID in the Search field.

The system displays any events associated with the address or network ID.

Geographic Location

Analytics associates public network IP addresses to geographic regions using the MaxMind GeoIP database. Traffic associated with these addresses shows as a heat map on the Map visualization on the sFlow®* dashboard. To filter on a region, draw a box or a polygon around the region.
Figure 4. Geographic Flow Source and Destination

Use the Square tool to draw a square around a region of interest, or use the Polygon tool to draw an irregular shape around a region. It will redraw the mapto zoom in on the selected region and to show details about traffic to or from the region.

Software Running in the Network

This section identifies specific applications or operating systems running on network hosts.

Top Talkers Using Well-known Layer-4 Ports
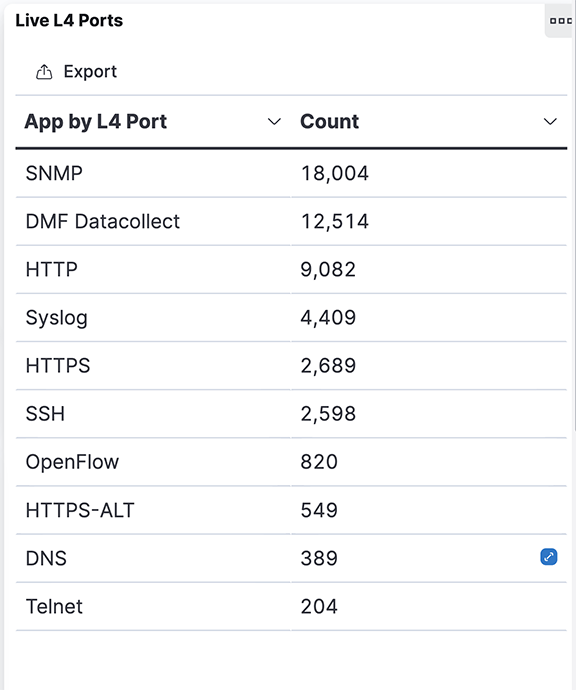
To view top-N statistics for the flows using a well-known L4 port, use the Live L4 Ports table on the Flows dashboard.
Figure 5. Flows > Live L4 Ports
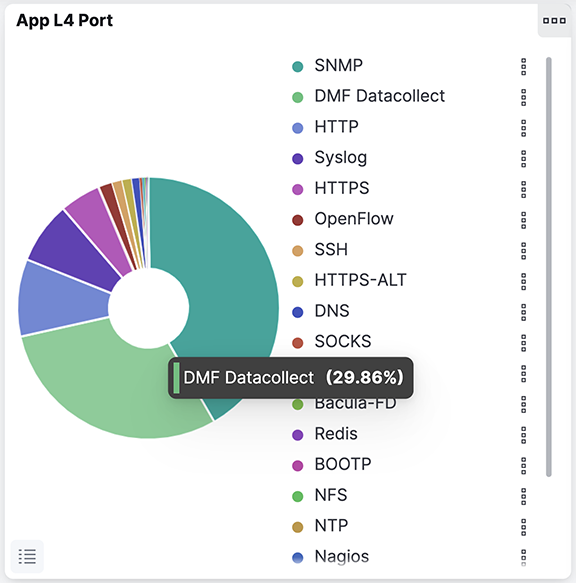
Use the App L4 Port table on the sFlows dashboard when a sFlow generator configured to send flows to Analytics.
Figure 6. sFlow > App L4 Port

These tables use well-known ports to identify the traffic generated by each application. You can also associate user-defined ports with applications as described in the following section.

Associating Applications with User-defined Layer4 Ports

To associate user-defined ports with applications, complete the following steps:
  1. Select System > Configuration.
  2. Select the Edit control to the right of the Ports section.
    Figure 7. Edit Ports
  3. To copy an existing row, enable the checkbox to the left of the row and select Duplicate from the drop-down menu.
    Figure 8. Duplicate Ports
  4. Type over the port number in the row you copied and enter an associated label.
    For example, assign port 1212 to Customer App X.
  5. Click save.

Software Running on Hosts

The following features identify the software running on hosts in the monitored network.
  • Searching for well-known applications
  • Using Layer4 labels
  • Searching packet captures on the DMF Recorder Node
  • Using the Flows dashboard
  • Using the DHCP dashboard for information about operating systems

The IP block default mapping associates many common applications with specific address ranges. For example, you can identify video traffic by searching for YouTube or Netflix.

L4 label strings identify applications using well-known ports and applications running on user-defined ports after mapping those ports to the applications.

The flow dashboards all give an overall sense of who is talking to whom. Click on an IP address or L4 port, and with the + that appears, pin that to filter the dashboard by the selection. Every dashboard has a bar chart depicting traffic on the y-axis and time on the x-axis. Note that a time filter can be added by a click and sideways selection of the bar chart.

The who can also be in terms of the user with a source of users to IP mappings (OpenVPN supported) configured. After that, a search by the user string for traffic attributed to that user over a dashboard period.
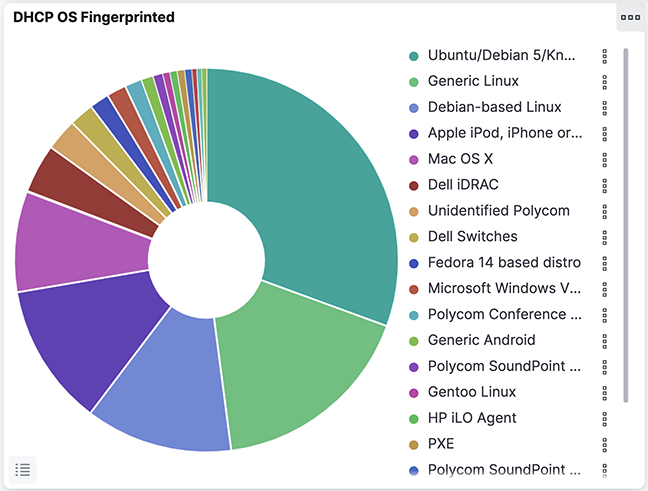
The DHCP dashboard indicates the operating systems running on hosts based on information derived from DHCP client requests. The default mapping is copied from the signatures provided by fingerbank.org.
Figure 9. DHCP OS Fingerprinting

Tools Receiving Traffic

Identify traffic forwarded to a specific tool or host using the IP Blocks mapping to associate an IP address or a range of IP addresses to a label describing the application. This label will then appear on any dashboards or visualizations that display the IP Block labels. After mapping, the search can happen for events associated with the label assigned to the tool.

Refer to the Mapping IP Address Blocks section for details about updating the IP block mapping file.

  1. To edit the IP blocks, select System > Configuration and click the Edit control to the right of the IP blocks section.
    Figure 10. Mapping a Tool to an IP Address: IP Block Edit
  2. To define a new IP block, append a range of IP addresses to the blocks section.
  3. Scroll down and add a tag definition with the same number as the IP block.
    Figure 11. Mapping a Tool to an IP Address: Define Tags
  4. Define the new IP block section tags, including a descriptive name for the specific tool.
  5. Select DMF Network > Policy Statistics.
    To cross-reference the information you get by labeling an IP block with information about any policies configured to forward traffic to that IP address.
    Figure 12. DMF Policies

User Activity

This section identifies specific users transmitting or receiving traffic on the network.

User Sessions

To identify users transmitting or receiving traffic on the network, use the following features:
  • Flows dashboard
  • sFlow dashboard
  • NetFlow dashboard
  • Open VPN or Active Directory mapping to IP address
The Flows dashboards all provide an overall idea of who communicates on the network (traffic source and destination).
Figure 13. Flows > Flows Source IP Dest IP
Click an IP address or L4 port, and with the + that appears, pin that to filter the dashboard for the selection. Every dashboard has a bar chart that shows traffic on the y-axis and time on the x-axis.
Figure 14. All Flows Over Time
To filter the display to a specific time, click and drag from left to right over the interesting period.
Figure 15. All flows Over Time (Specific Time)

It can also identify traffic associated with specific users after using the IP blocks configuration to map them to a specific IP address. Once saved, it can search for the user string to see traffic attributed to that user over the period displayed on the dashboard.

New Network Users

To identify new network users, use the following features:
  • Comparing the same dashboard for two different periods
  • sFlow > Count sFlow vs Last Wk
  • ARP dashboard
  • New Host Report
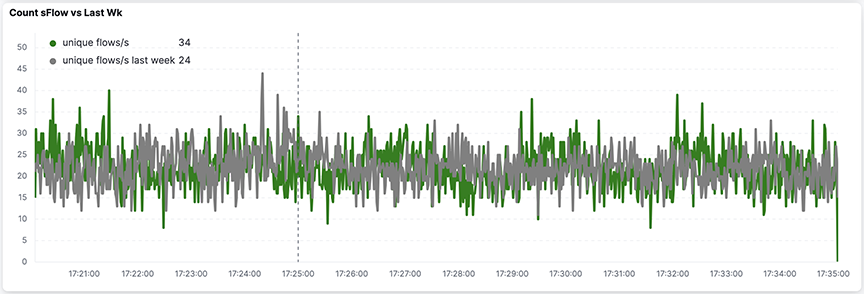
The sFlow dashboard provides a Count sFlow vs Last Wk visualization, which shows the number of unique flows being seen now vs. last week.
Figure 16. sFlow > Count sFlow vs Last Wk
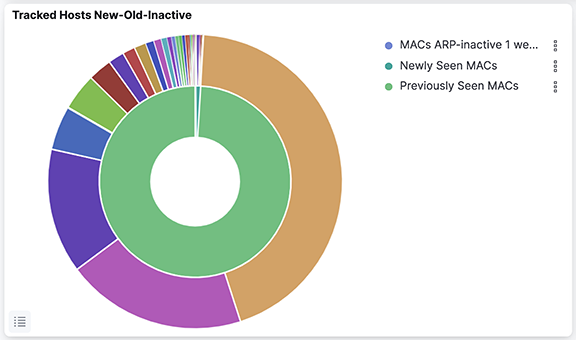
The ARP dashboard provides a visualization for Tracked Hosts New-Old-Inactive, Vendor.
Figure 17. ARP > Tracked Hosts New-Old-Inactive, Vendor
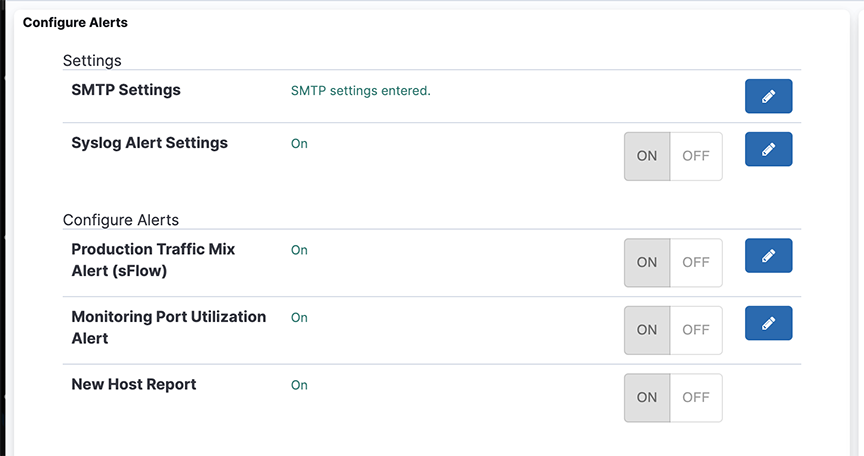
To use the New Host report, enable the report and configure where to send alerts on the System > Configuration page.
Figure 18. System > Configuration > New Host Report

Unauthorized Intranet Activity

To identify unauthorized usage of your internal network, use the following features:
  • Malicious vs. compromised vs. apt zero-day vs. known threats. It enables the association of flows to users and flows to internal organizations.
  • Searching by the username will reveal access to different organizations and their Apps.
  • For OpenVPN users, when the IP is from a different geographical location, it shows the user's external IP. It may indicate a compromised account, especially in combination with access at odd hours.
  • The OpenVPN server records logins with IP addresses and computer type, assigns IP addresses inside the lab, and sends Syslog on OpenVPN.
  • Use the DMF Recorder Node to retrieve the original packets for forensic analysis and to obtain evidence of unauthorized activity.

Monitoring Active Directory Users

Windows Active Directory should be configured to audit logon and logoff events on Active Directory.
  1. Download and install Winlogbeat from the Elastic website on the Windows machine. Download Winlogbeat.
  2. On the Analytics node, run: sudo rm -rf * inside /home/admin/xcollector and then run docker exec xcollect /home/logstash/generate_client_keys.sh <AN IP> client. It generates .pem files in /home/admin/xcollector.
  3. On the Analytics node machine, replace the winlogbeat.yml file from /opt/bigswitch/conf/x_collector/winlogbeat.yml to the one in the Windows server. Edit the logstash output section:
    #----------------------------- Logstash output ----------------------------------
    output.logstash:
    #Point agent to analytics IPv4 in hosts below hosts: ["10.2.5.10:5043"]
    
    #List of root certificates for HTTPS server verifications ssl.certificate_authorities: ["C:/Program Files/Winlogbeat/security/ca/cacert.pem"]
    
    #Certificate for SSL client authentication
    ssl.certificate: "C:/Program Files/Winlogbeat/security/clientcert.pem"
    
    
    #Client Certificate Key
    ssl.key: "C:/Program Files/Winlogbeat/security/clientkey.pem"
    
  4. Using the recovery account, use an SCP application to transfer the .pem files from the Analytics node to the Windows machine and update their locations in winlogbeat.yml.
  5. On Windows, enter the powershell, navigate to winlogbeat.exe, and run: .install-service-winlogbeat.ps1 to install Winlogbeat.
  6. Test the configuration using “winlogbeat test config” to test winlogbeat.yml syntax and “winlogbeat test output” to test connectivity with logstash on the Analytics node.
  7. Run winlogbeat run -e to start Winlogbeat.
*sFlow® is a registered trademark of Inmon Corp.