DMF GUI REST API Inspector
Overview
DANZ Monitoring Fabric (DMF) 8.6 introduces a newly designed API Inspector available on all DMF UI pages. Previously, the former API Inspector was accessible by selecting the Dragonfly icon, and it was only available on some pages.
Launch the API Inspector
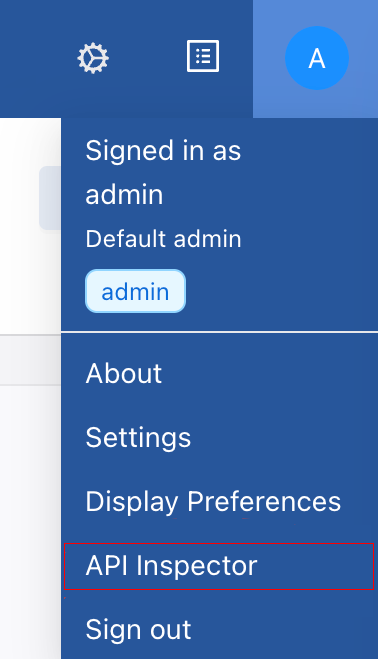
- Hover over and select the User icon to see the drop-down menu.
- Select API Inspector to open the API Inspector table.
- The REST API Inspector table appears between the page content and the navigation bar. It will remain open when switching between pages.
- To close it, select API Inspector or the × icon.
API Requests Tab
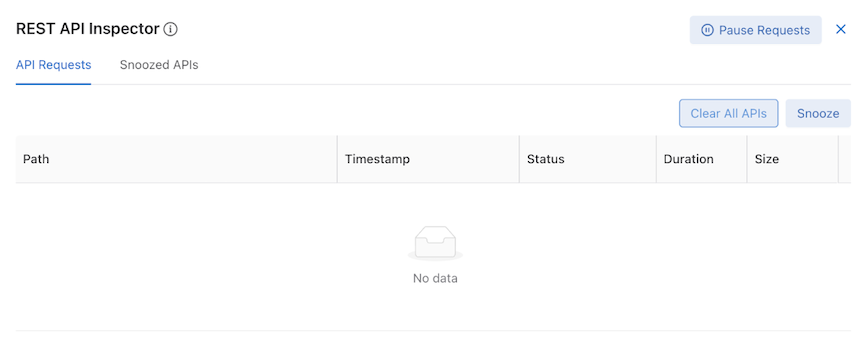
API Requests contains a table displaying all recent API requests and several utility buttons.
API Requests Table
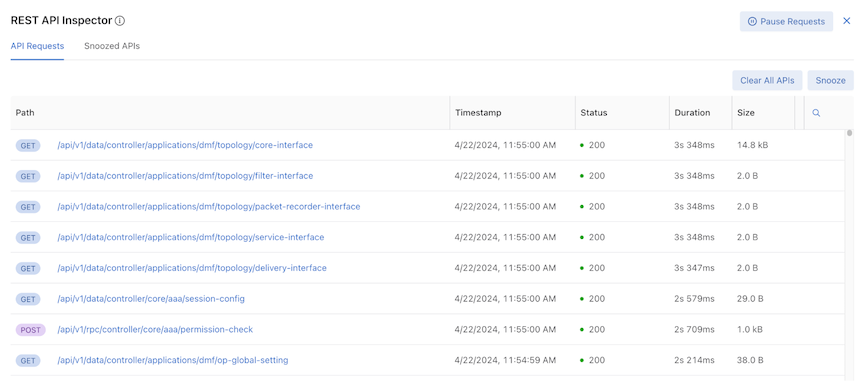
Each row contains specific API request information:
- Path – HTTP request method and URL
- Timestamp – date and approximate time
- Status – HTTP response codes
- Duration – time taken to receive a response
- Size – response body size
The table logs the latest 500 API requests and automatically updates when new API calls are received.
Search

The table's results are searchable. Selecting the magnifying glass icon displays a Type to Search line in the first row.

The table supports search by Path, HTTP Method, and Status column contexts.
Interaction
Selecting a URL expands specific API requests and enters the Detailed API Request View.

Use Pause Requests to stop tracking new API requests. An alert message appears next to the REST API Inspector title.

During the pause, the button changes to Resume Requests. To resume tracking API requests, select Resume Requests. The table updates accordingly.

Clear All APIs Button

To clear the entire table, select Clear All APIs.
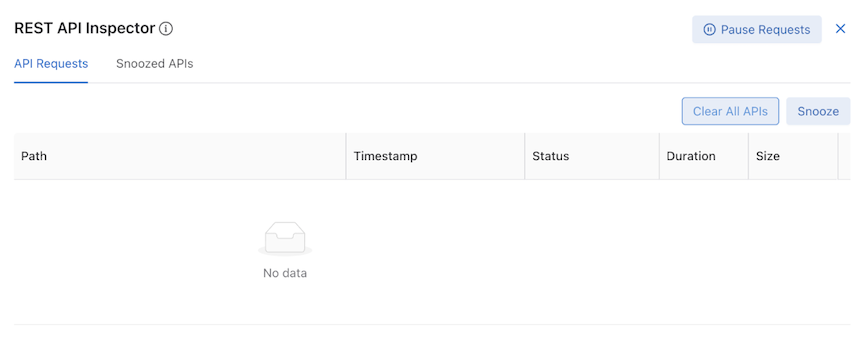
The Snoozed API table is not affected. API Inspector continues receiving and displaying new requests in the table.

Using Snooze makes the table rows selectable, and the Snooze button changes to Snooze Selected APIs. Clicking Cancel or Snooze Selected APIs returns the table entries to an unselected state.

During the selectable state, select specific API Requests and select Snooze Selected APIs to prevent them from appearing in the table.
Snoozed APIs Tab
Snoozed APIs display all snoozed API requests.
Snoozed APIs Table
The snoozed APIs table is empty by default.
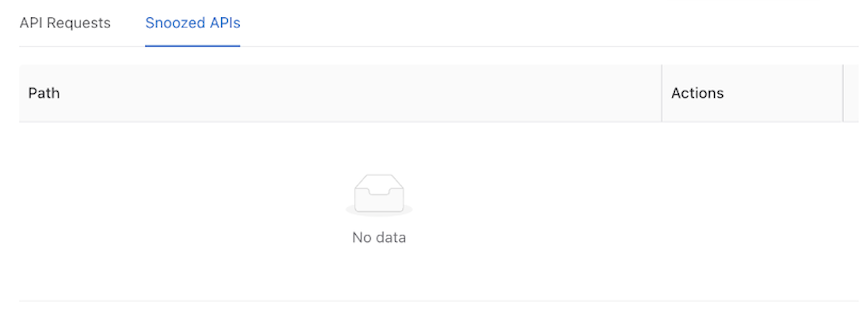
The table displays snoozed APIs. However, unlike the API Requests table, the Snoozed API table only distinguishes API requests by URL and HTTP Method. Requests with the same URL only appear once in the Snoozed API Table.
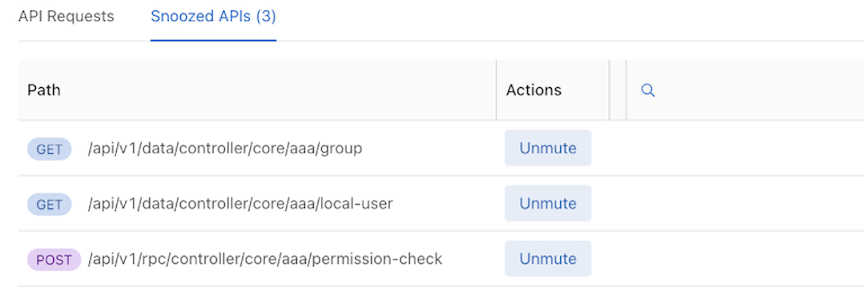
Search

The table's results are searchable. Selecting the magnifying glass icon displays a Type to Search line in the first row.

The Snoozed APIs table supports search by Path columns contexts only.
Unmute resumes tracking the API request and updates the table. Any requests with the same URL that occur going forward are added to the API requests table.
Detail API Requests View
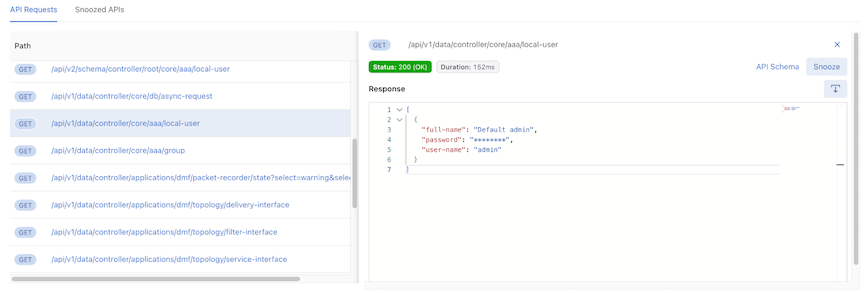
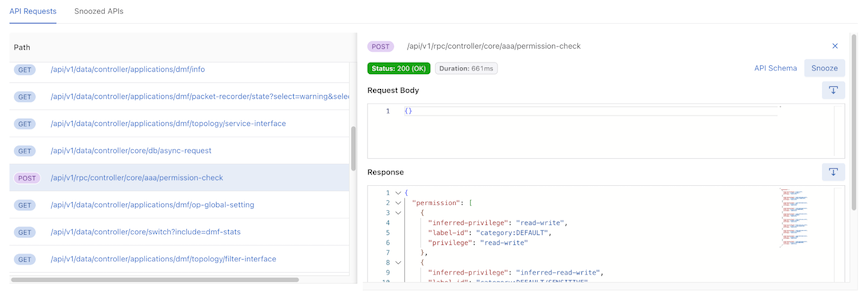
Selecting a URL in the API Requests table expands that specific API request and enters the Detail API Requests view.
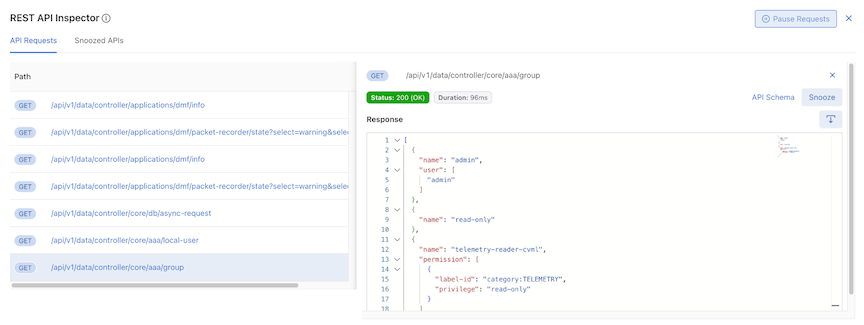
The UI displays a truncated API Requests table and a detailed view; selecting another URL changes the detailed information in the detailed view.
Information on the selected API request includes:
-
HTTP methods – show the HTTP methods
-
Response status – show the response status and response text
-
Duration – show the duration of the API request
-
API Schema link button – Open a new tab to the API Schema Browser Page
-
Snooze – Snooze this selected API request (same as Snooze Button )
-
Response – Show all the response information of this selected API request
-
Download Icon – Download response information into a .json file.
-
Use the download icon to download the request body information into a .json file.
-
API Inspector obfuscates sensitive values such as password, hash ID, hash password, auth session, encode result, and secret by replacing them with ********.
