Engage
With the Engage functionality, network administrators or Guestbook operators can configure and manage guest user accounts from CloudVision Cognitive Unified Edge (CV-CUE). Engage functionality also lets network administrators analyze the various statistics and demographic profiles of guest users who access your Wi-Fi setup. You can obtain the user profiles by using custom plug-ins, except Clickthrough, or through entries from a private guest book.
Users access the Wi-Fi through custom captive portals created in CV-CUE. These portals can be configured to enable users to access the Wi-Fi by using their credentials or by using user accounts that you have created in the portal guest book.
Manage Guest Users
Network administrators or Guestbook operators can configure and manage guest user accounts using the Engage > Users tab. As a network administrator, you can create multiple user accounts, set their credentials, and share the account details with the guest users over email. You can create individual user accounts or create user accounts in bulk. Guest users can use these administrator-generated credentials to access the internet through your Wi-Fi setup.
- Allow Guest Users to Self-Register: Users can self-register directly from the splash page. Administrators can modify the user account settings once the user successfully registers.
- Admin Generated Credentials:Administrators can create users or user batches and share the account credentials and details with the guest users.

Use Case
Consider a scenario where you are conducting a seminar or an event for a large number of users. You want to allow these users to access your Wi-Fi network for a short period of time and once the event is done, you need to revoke the access. You can achieve this by creating a batch of users or by importing a large number of users. You can set the validity of the user accounts, login-limits, device limits, and also specify Quality of Service Setting parameters to ensure smooth connectivity.
Create Users
To create a user account:
- Go to
- From the drop-down menu, select the SSID profile with the configured captive portal.
- Click Add and provide the following details:
Field Description User Name Name of the guest user account. Password Password for the guest user account. Email Email address of the guest user to send notifications. User Status Set it as Unlocked to enable the user to access the network. Validity Set the time duration for which you want the user to be able to access the network. Guest users will not be able to access the network once the validity expires. SSID Name SSID Name on which the user is available. SSID Key SSID Key to get access to the SSID on which the user is available. Device Limit The maximum number of devices a guest user can simultaneously log in. Login Limit The number of times the guest user can log-in from the splash page using these credentials. If the account is valid and the user has crossed the login count limit,the user will not be allowed to log-in. Quality of service settings Login Timeout The time period after which the guest user session expires. The user must re-authenticate with their login credentials to continue using the Wi-Fi service. If you leave this setting blank, the user session does not timeout and the user must explicitly log out from the portal. Blackout Time The time period during which a user cannot log in to the portal after the last successful login has timed out. Max Download Bandwidth The maximum download bandwidth, in Kbps, for the guest user. Max Upload Bandwidth The maximum upload bandwidth, in Kbps, for the guest user. - Save the settings.
Importing Users
You can also import multiple users by providing the user details in a .csv file.
To import Users,
- Go toand click Import Users.

- Upload a .csv file with the user details.

You can view the imported users in the User tab. Users imported from .csv file are tagged as batch users and a batch is created for every imported .csv file. The username prefix is left blank for imported users.
Create User Batches
You can also create multiple users simultaneously by creating a batch of users. Creating a batch of users is useful when you need to create a large number of guest user accounts.
To create a user batch:
- Go to
- From the drop-down menu, select the SSID Profile with the configured captive portal.
- Click Add and provide the following details:
Field Description Username Prefix Prefix for the guest user accounts batch. This is applied to all the users in the batch. Batch Type - Select Random Users to generate users with random user names with the specified prefix in the guest user batch.
- Select Incrementing Users to generate usernames with the specified prefix and an incremental index in the batch.
Username Length The length of the user name. This setting is available only for Random Users. Start Index The numerical index to start the user names. This setting is available only for Incrementing Users. Password Length Length of the password. Number of Users The number of users to create in this batch. Expires At Set the time to expire the validity of all the users in this batch. - Specify the Login Limit, Device Limit, and Quality of service setting parameters applicable to all users in this batch.
- Save the settings.
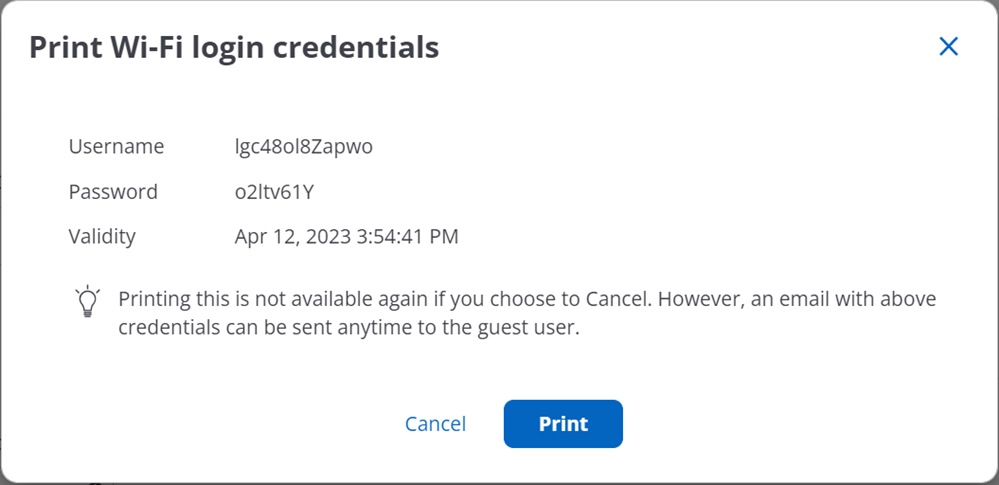
You can export the created user batch to retrieve the usernames and passwords and share them with your guest users.
Guest Insights
View Guest Overview
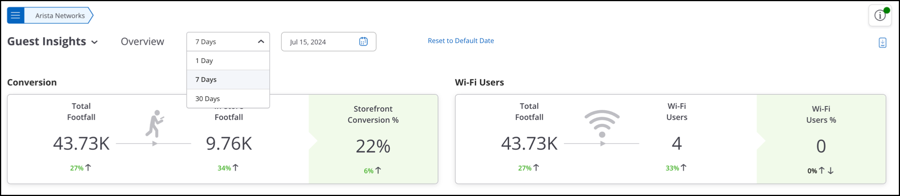
All charts on the Overview tab display data for Today’s date. To view overview-related data for a specific date, select the date from the date picker at the top.
The Overview tab contains the following charts:
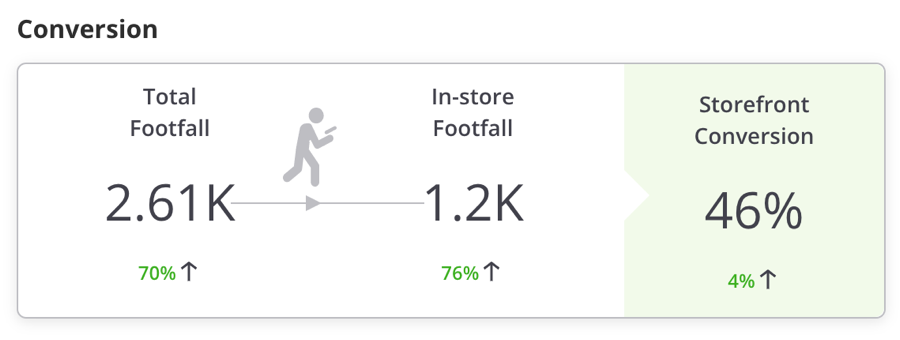
Conversion
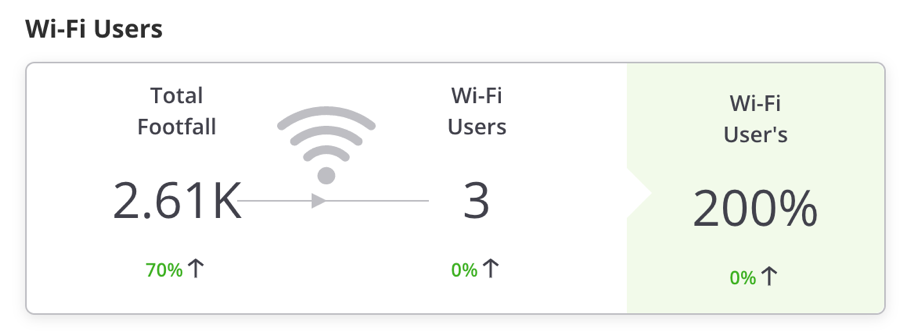
Wi-Fi Users
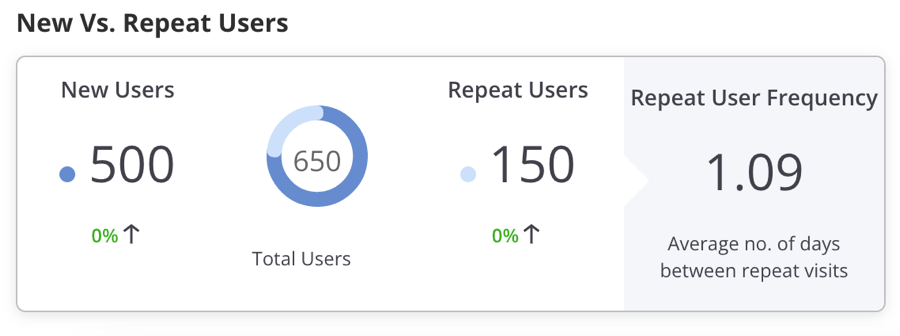
New vs. Repeat Users
The New Vs Repeat Users widget indicates the total number of users using the guest Wi-Fi, along with the percentage of new and repeat users. It also presents the average number of days between visits for repeat users.
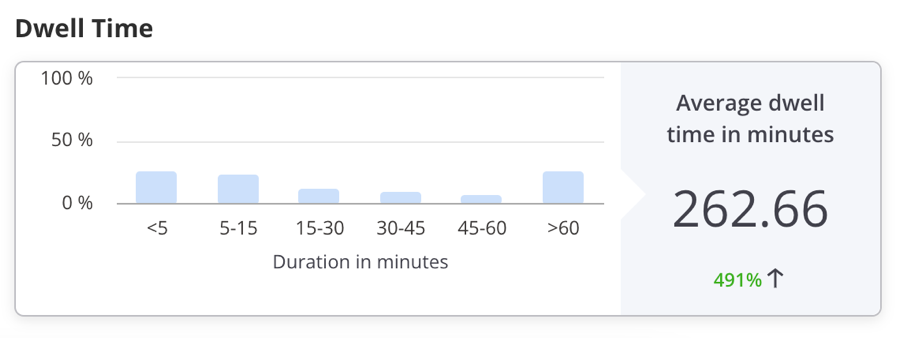
Dwell Time
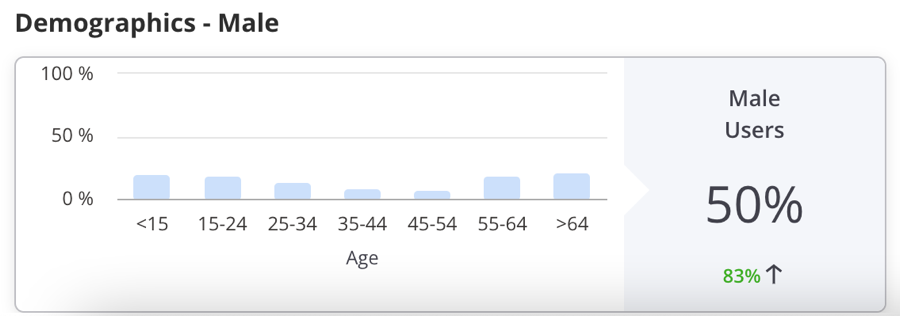
Demographics - Male
The Demographics - Male widget displays the percentage of male users using the guest Wi-Fi through a social media plugin. This data is derived from the social media sites used by the guest Wi-Fi users to log in to CV-CUE.
Demographics - Female
The Demographics - Female widget displays the percentage of female users using the guest Wi-Fi through a social media plugin. This data is derived from the social media sites used by the guest Wi-Fi users to log in to CV-CUE.

View Guest Presence
To view Guest Presence data, navigate to
All charts on the Presence tab display data for Today’s date. To view presence-related data for a specific date, select the date from the date picker at the top.
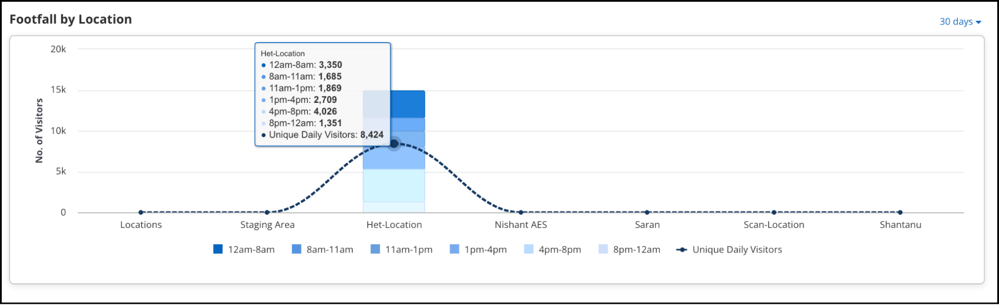
Footfall by Duration
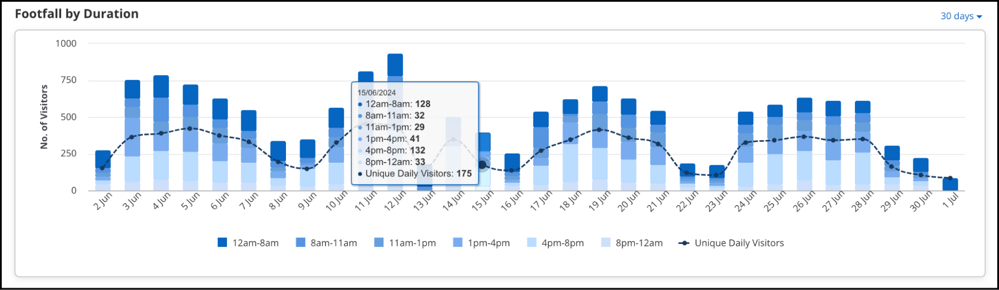
When you need a 7 day chart, you will easily be able to track the per day data of the visitors in and around the store from Monday to Sunday. But when you go for >60 days slot you will be able to see per week data for 60 days. And for 365 days you can view the per month data. The granularity changes as per the data distribution for the duration. If a user accesses the Wi-Fi in a particular time slot like 8 am-12 pm multiple times, it will be counted as one visit for that time slot. But if the user logs in under different time slots, the user will be counted different for each time but for an overall view for the parent location, the guest user will be counted as one visitor.
Similarly, If a user logs in through different devices in the same time slot or different slot, the user will be counted as a different visitor each time as that login depends on the MAC address of the device. Different MAC addresses will count as different visitors.
Footfall by Location
Dwell Time by Duration
This is a bar graph showing total number of users who have accessed the Wi-Fi for different time periods during each visit for the specified duration and at the selected location.
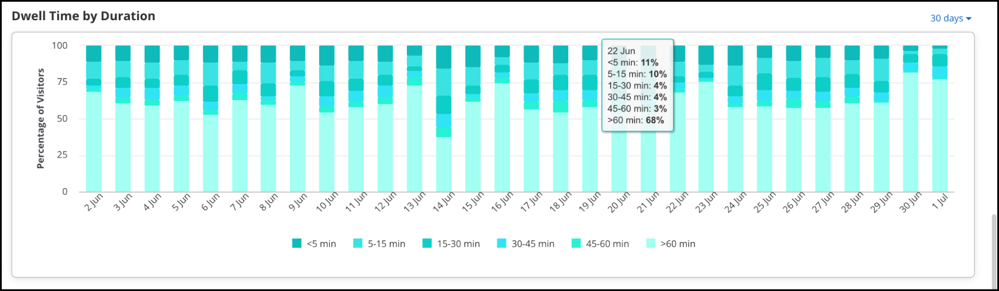
The Dwell time depends on the received RSSI value. The relative signal strength of the Wi-Fi is considered to be good the more its value is close to 0. So, when a client connects for a particular time slot its duration is mapped. This is again an aggregated data. Suppose, in the time slot of 8-11 am, a client logs in at 8-9 am for 4 minutes and again logs in from 9-10 am for 3 minutes. The total time slot of the client will be 4+3= 7 minutes and will be depicted on the chart, accordingly.
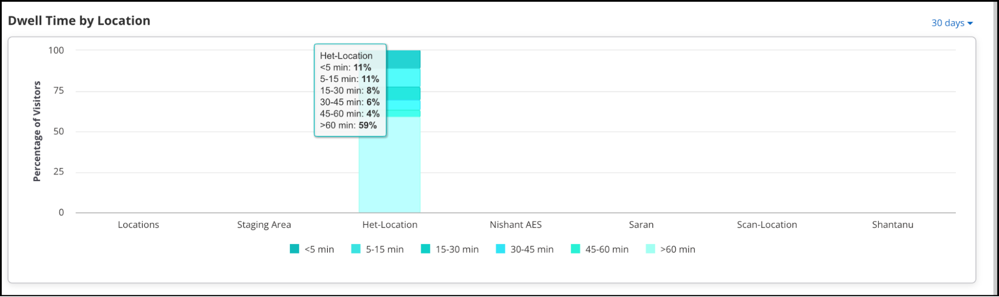
Dwell Time by Location
View Guest Demographics
To view Guest Demographics data, navigate to Demographic charts provide social analytic information for guest users who use Wi-Fi by authenticating with their social media accounts.
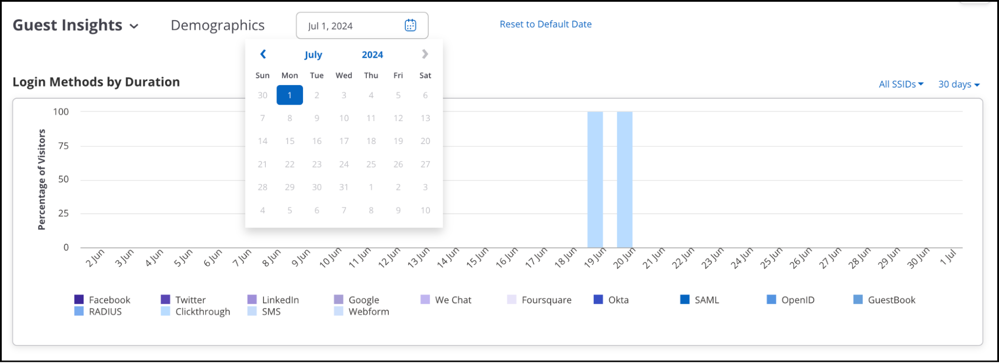
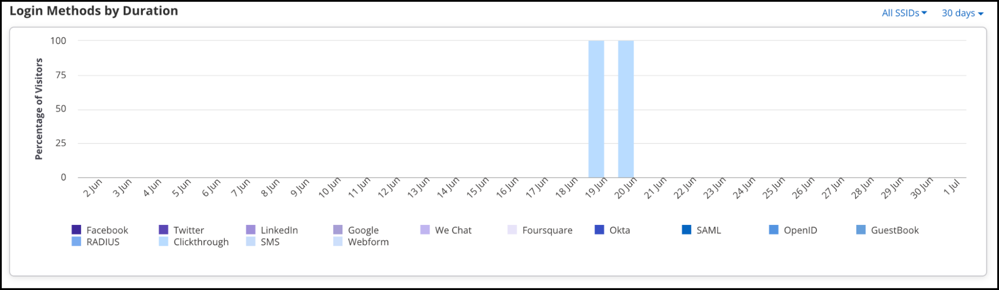
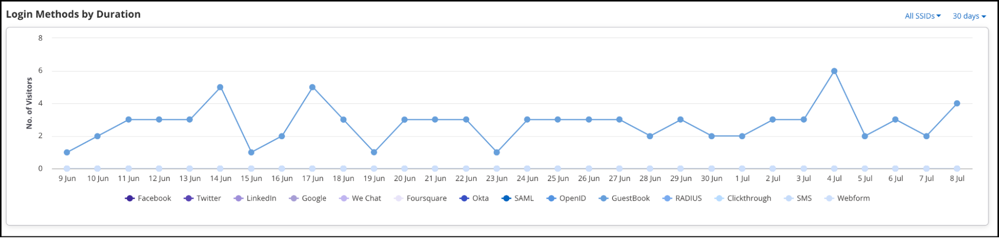
Login Methods by Duration
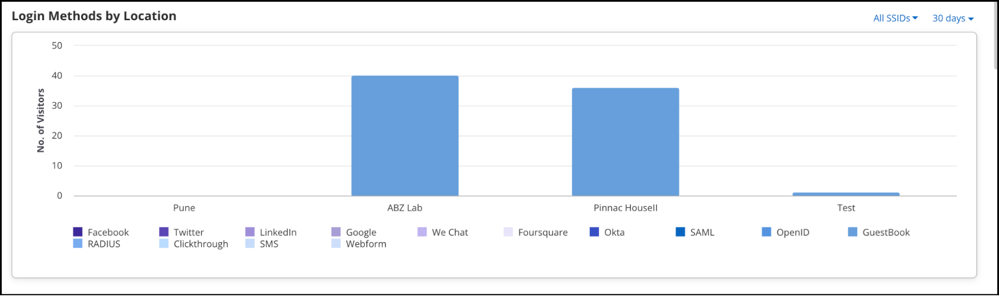
Login Methods by Location
This is a bar graph showing the login method-wise percentage of guests for the selected location and its child locations who have accessed the Wi-Fi during the specified time duration for the selected SSID.
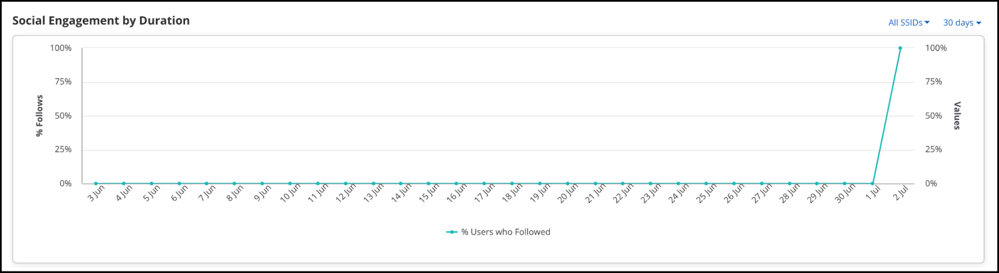
Social Engagement by Duration
This is a chart showing the number of guest users who logged in using a social media application and engaged with the platform for a selected duration.
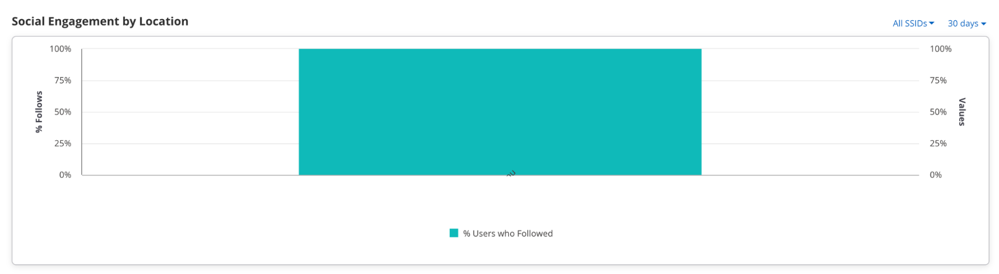
Social Engagement by Location
This is a chart showing the number of guest users who logged in using a social media application and engaged with the platform for a selected location.
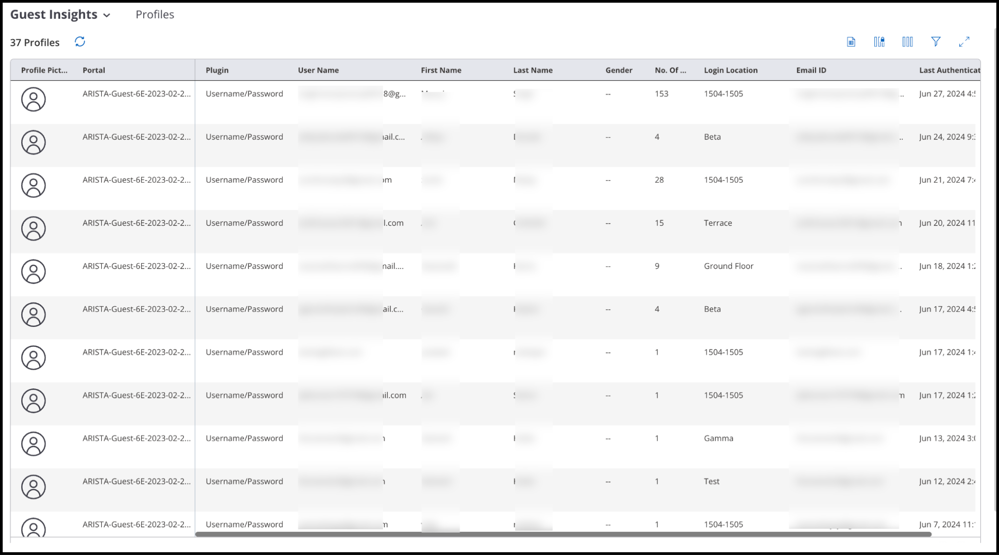
View Guest Profiles
To view Guest Profiles, navigate to The Profiles tab displays the guest profile information available for each location in the location tree.
The profile information of guests or visitors is presented in a tabular format. The information displayed is the information that the guest user has allowed to be displayed. When a user logs in to Wi-Fi, he logs in through a plugin, such as a Social plugin, Guestbook, or Webform. While logging in through the plugin, the user is asked to fill in various fields. Those fields, such as profile picture, portal, plugin, gender, or location, are displayed in the Profile tab.
| Field | Description |
|---|---|
| Profile Picture | The photograph of the guest. This is retrieved from the social media site based on the respective social media account the user uses to access the Wi-Fi. |
| Portal | The name of the portal used to access the Wi- Fi. |
| Plugin | Name of the plug-in used to authenticate. |
| User Name | Login name of the guest as mentioned on the social media account. |
| First Name | First name of the guest as mentioned on the social media account. |
| Last Name | Last name of the guest as mentioned on the social media account. |
| Gender | Gender of the guest as mentioned on the social media account. |
| Number of Visits | Number of visits by the guest to the portal. |
| Location | Location of the guest as mentioned on the social media account. |
| Login Location | Location of the AP to which the guest connected. This is the location defined in the Wireless Manager. |
| Email ID | The E-mail ID of the guest as mentioned on the social media account. |
| Last Authentication Time | Date and time of the last visit by the guest to the portal. |
| Client MAC | MAC Address of the client. |
| Age Range | Age range of the guest. |
| Phone Number | Phone number of the guest as mentioned on the social media account. |
| Languages | Languages known to the guest as mentioned on the social media account. |
| Friends Count | Number of friends the user has on the social media account. |
| Followers Count | Number of followers as mentioned on the social media account. |
| DOB Day | Day of birth of the guest as mentioned on the social media account. |
| DOB Month | Month of birth of the guest as mentioned on the social media account. |
| DOB Year | Year of birth of the guest as mentioned on the social media account. |
| Date Created | Date of account creation. |
| Last Skip Time | Date and time of the last splash page skipped by the guest user. |
| Skip Visit Count | Number of time the guest user skipped the splash page. |
| Membership ID | Membership ID of the guest user. |
| Marketing Opt-in | Marketing Opt-in if used by guest user. |
View Wi-Fi Usage
To view Wi-Fi Usage data, navigate to WiFi Usage tab contains the following charts:
- Data Transfer by Duration
- Data Transfer by Location
Data Transfer by Duration
This is a line graph that plots the data received and transmitted and the total data exchange over the specified duration at the selected location for the selected SSID.
![]()
Data Transfer by Location
This is a bar graph that plots the data transmitted and received for the specified duration at the selected location and its immediate child locations for the selected SSID. When you select a particular location from the root folder, the chart depicts the total Wi-Fi usage done in that particular location. The line data shows the data that is being transferred from AP to the client(download data) and from the client to the AP(upload data). The data transferred can be chosen for a particular location along with its child locations, SSID or duration. An aggregated data for the location is presented.
![]()
Guest Insights for Clients with Random MAC Addresses
iOS, Android, and Windows OS have introduced the use of randomly generated, locally-administered MAC addresses for Wi-Fi clients. It is done to hide the hardware MAC for security reasons. As a result, identifying such devices by its MAC is not possible because the MAC address keeps changing with time.
When clients with random MAC addresses connect to an AP, the actual count and the absolute count of the clients are vastly different. Due to MAC Randomization, the same client can connect multiple times with an AP using MAC addresses in a shorter duration. The AP will consider such clients as different clients as the MAC addresses are different in every association. When clients with randomly assigned MAC addresses connect to CV-CUE, CV-CUE uses an approximation algorithm to identify such clients. GM then displays a percentage approximation of such clients in all the client-association charts, instead of displaying the actual count.
Login Method by Duration with MAC Randomization Enabled:

Login Method by Duration with MAC Randomization Disabled:
- Overview > Conversion: Shows only the total footfall.
- Overview > Wi-Fi Users: Shows only the percentage change in footfall instead of the absolute count.
- Overview > New us Repeat Users: Not available if MAC Randomization is enabled. Instead, a widget displaying Repeat Users is shown.
- Overview > Dwell Time: Shows approximate number.
- Overview > Demographics - Male: Not affected by MAC Randomization.
- Overview > Demographics - Female: Not affected by MAC Randomization.
- Presence > Footfall by Duration: Shows an approximate number instead of total count.
- Presence > Footfall by Location: Shows an approximate number instead of total count.
- Presence > Dwell Time by Duration: Converted the Y-axis into an approximate percentage count instead of an absolute count.
- Presence > Dwell Time by Location: Converted the Y-axis into an approximate percentage count instead of an absolute count.
- Demographics > Login Methods by Duration: Y-axis shows the approximate percentage count instead of the absolute count of visitors.
- Demographics > Login Methods by Location: Y-axis shows the approximate percentage count instead of the absolute count of visitors.
- Demographics > Social Engagement by Duration: Y-axis shows the approximate percentage count instead of the absolute count of visitors.
- Demographics > Social Engagement by Location: Y-axis shows the approximate percentage count instead of the absolute count of visitors.
Portal Management
Network Administrators can create and configure portals to authenticate guest users in their Wi-Fi setup. You can configure portals with a combination of plug-ins.
You must have an Administrator role to create and manage portals. After you configure the portal, you must configure the SSID profile to update the captive portal and walled garden settings. These settings ensure that the guest is redirected to the captive portal when they connect to the SSID and also enable social media access for user authentication before enabling Internet access.
A social media plug-in can be configured to send real-time guest user profile information to a third-party application when a guest logs in successfully using the plug-in. Based on the information, a personalized message or some personalized offers can be presented to the guest.
A portal must have a splash page and an optional landing page. Splash pages and landing pages can be designed and managed through Canvas. Once created, the pages can be associated with a campaign defined in Canvas, a web app that enables you to design on-site guest engagement campaigns. A campaign must be published before it can be associated with a portal in the Guest Manager. To publish a campaign, it must have a splash page. A published campaign can contain only one active splash page and one active landing page.
This chapter contains the following topics:
Creating a Portal
Network administrators can create portals to authenticate guest users in their Wi-Fi setup.
To create a Portal:
- Navigate to .
- Click Create New Portal. The new portal window opens.
- Enter the following information under the Basic Settings tab:
- Portal Name: Name of the portal.
- Display Name: Name of the portal to display.
- Shared Secret: The passphrase for secure communication between the access point and the portal. If a shared secret is configured on the SSID in Wireless Manager, you must configure the same shared secret in the portal.
- Active: Select to activate the portal.
- Sign-out Popup: Select to display a sign-out popup to a guest user when they sign in to the portal.
- Skip Splash page: Select to show the splash page once only. If this option is selected, Guest Wi-Fi users will see the splash page only the first time they access the Internet. The authentication method is recorded, and the guests are not shown the splash page on their subsequent visits within the duration specified. This setting is not applicable if the guest uses Clickthrough or RADIUS plug-in for authentication. If you select Skip Splash Page, set the Application Usage Time to define the number of days for which the returning guest Wi-Fi user will not have to authenticate through the splash page.
- These are the basic settings for creating a portal. You can now define the plugins to configure your portal.
- Navigate to Plugins and QoS tab. Select the portal plug-ins to activate the respective plug-ins on this portal. At least one plug-in must be selected to complete the portal creation. For information on Plugins and QoS settings, refer to Plugins and QoS Settings.
- Configure Campaigns.
- You can configure the common settings for all Plugins by clicking the gear icon from the top panel.
Note: If you have activated plug-ins other than the Clickthrough plug-in in the portal, then the splash page in the default campaign must be modified to include the selected plug-ins. This can be done with Canvas.
- Click Save.
QoS Settings
Quality of Service and Redirect URL are the two common settings to be configured for every plugin.
| Field | Description |
|---|---|
| Login Timeout | The time period after which the guest user session for the portal expires. The user must re-authenticate with his login credentials if he wants to continue using the Wi-Fi service. "0" indicates that the user session does not timeout and the user must explicitly log out from the portal. A non-zero timeout configured on the plug-in takes precedence over the timeout configured on the SSID profile. The time period, can be specified in Hours, Minutes, Days, Weeks or Months. |
| Blackout Time | The time period for which a user cannot log in to the portal after the last successful login has timed out. "0" indicates no blackout time. The blackout time configured on the plug-in takes precedence over the blackout time configured on the SSID profile. The time period, can be specified in Hours, Minutes, Days, Weeks or Months. |
| Max Download Bandwidth | Maximum download bandwidth, in Kbps or Mbps, for this plug-in on the portal. |
| Max Upload Bandwidth | Maximum upload bandwidth, in Kbps or Mbps, for this plug-in on the portal. |
| Redirect URL | The URL of the page to which the guest user must be redirected to on successful login from the portal using the plug-in. |
| Third Party Endpoint (Notify) | On successful authentication, the Notification Parameters will be sent to the End Point. |
Supported Plugins
CV-CUE supports the following plugins:
- Clickthrough Plugin: This plug-in enables a guest to access Internet without any authentication. You can configure your portal page such that the guest must first accept some Terms and Conditions before obtaining Internet access.
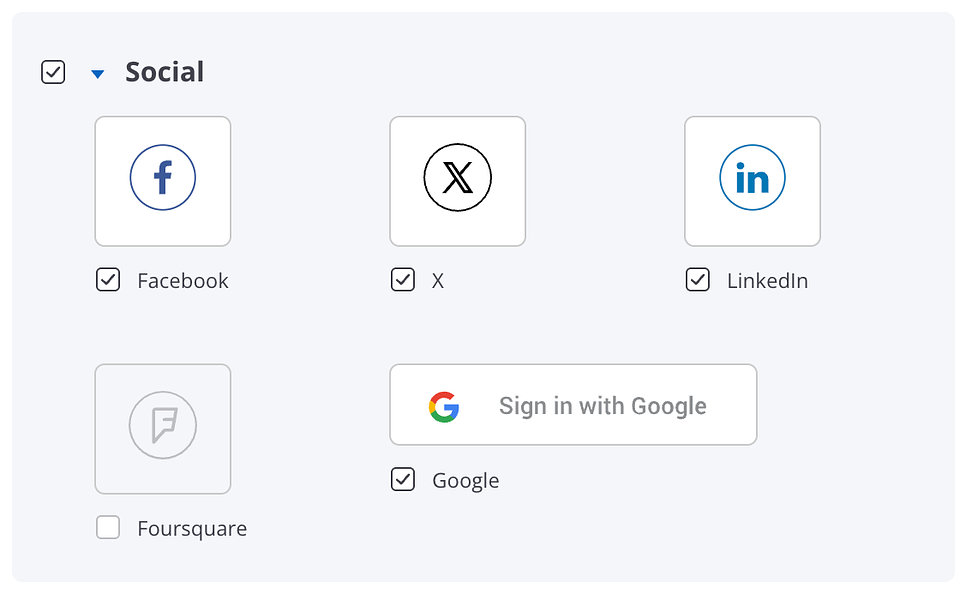
- Social: Social media plug-ins allow guests to authenticate with their social media account credentials. You can use Facebook, X, LinkedIn, Okta, Google, and Foursquare.
- Username/Password: Guests can authenticate using this plug- in by entering the account credentials provided by you. These credentials are defined by you in the Guest Manager.
- Passcode through SMS: The SMS plug-in enables a guest to obtain an Internet access code through SMS on the mobile/cellphone number provided by him on the portal page.
- Webform
- Custom
This chapter contains the following topics:
Configure Clickthrough Plugin
This plug-in enables a guest to access the Internet without any authentication. You can configure your portal page such that the guest must first accept some Terms and Conditions before obtaining Internet access.
To configure Clickthrough plugin:
- Select Clickthrough.
- Click the edit icon next to it.
- Configure the QoS settings.
- Set the Redirect URL and Third Party Endpoint to notify.
- Click Save.
Configure Social Plugins
You can configure social media plug-ins on your Engage portal. You must configure only the plug-ins that you have selected for your portal. When guests try to access the Wi-Fi through an Access Point (AP), the portal page is displayed. The portal provides options for authenticating with social media accounts. When a guest chooses a social media to authenticate, the portal redirects the user to the social media login page for their social media account credentials. The social media validates the user account credentials. If successful, the portal and the social media exchange certain information and perform a handshake. The user is requested for permission to share some of the information in his social media account with the social media App. The social media checks whether the user Likes or Follows your page on the social media and, if not, requests the user to Like or Follow your page. The AP then opens the gate for the users to access the Internet.
This chapter contains the following topics:
Configure Facebook Plugin
To configure the Facebook plug-in on your engage portal, you need to know App ID and App Secret of your Facebook App.
To configure the Facebook plug-in:
- Click Portals.
- Click the portal name for which you want to configure the Facebook plug-in.
- Click the Plugins and QoS tab. Under the Social section, select the Facebook icon to enable the Facebook plug-in for the portal.
- Provide the Facebook plug-in information.
Field Description App ID App ID provided by Facebook to communicate with the Facebook API. App Secret App secret that Guest Manager uses to connect to Facebook App. Display Link Page Enable this to mandate your guests to ike your Facebook page when they authenticate using their Facebook account credentials. If selected, a notification with a Like button (a thumbs- up icon) is displayed, requesting the user to Like the Facebook page. If you select this, the Likes check box under Extend User Profile Permissions is automatically selected. Extended Profile Permissions Select this setting to ask the guest user for permission to access additional information such as email address, birthday, and location. If selected, the user is asked for permissions to access the selected information from the user profile. Select the check boxes for the information fields(Email address, Birthday, Likes, Location) that you want to request access for from the guest user. - Configure the QoS Settings
- Click Save.
The Facebook plug-in configuration data is displayed on the Facebook page of the selected portal.
Configure X Plugin
Configure the X plug-in to enable guest authentication through X social media accounts.
To configure the X plug-in, perform the following steps:
- Click Portals.
- Click the portal name for which you want to configure the X plug-in.
- Click the Plugins and QoS tab. Select the X icon under Social section to enable the X plug-in for the portal.
- Provide the X plug-in information.
Field Description Consumer Key Key provided by X to communicate with the X API. Consumer Secret Secret that Guest Manager uses to connect to X. Display Follow Page Whether the guests must Follow you on X when they authenticate using their X account credentials. If selected, a notification with a Follow button is displayed requesting the user to Follow the X page. Provide the Follow Page URL that the guests can see and follow. - Configure the QoS Settings.
- Click Save.
The X plug-in configuration data is displayed on the X page of the selected portal.
Configure LinkedIn Plugin
Configure the LinkedIn plug-in to enable guest authentication through LinkedIn social media accounts.
To configure the LinkedIn plug-in, perform the following steps:
- Click Portals.
- Click the portal name for which you want to configure the LinkedIn plug-in.
- Click the Plugins and QoS tab. Seclect the LinkedIn icon under Social section to enable the LinkedIn plug-in for the portal.
- Provide the LinkedIn plug-in information.
Field Description App ID App ID provided by LinkedIn to communicate with the LinkedIn API. Secret Key Secret that Guest Manager uses to connect to LinkedIn. Display Follow Page Whether the guests must Follow you on LinkedIn when they authenticate using their LinkedIn account credentials. If selected, a notification with a Follow button is displayed requesting the user to Follow the LinkedIn page. Provide the Follow Page URL that the guests can see and follow. - Configure the QoS Settings.
- Click Save.
The LinkedIn plug-in configuration data is displayed on the LinkedIn page of the selected portal.
Configure Google Plugin
Configure the Google plug-in to enable guest authentication through Google accounts.
To configure the Google plug-in, perform the following steps:
- Click Portals.
- Click the portal name for which you want to configure the Google plug-in.
- Click the Plugins and QoS tab. Under the Social section, select the Google icon to enable the Google plug-in for the portal.
- Provide the following information:
Field Description Client ID An identifier provided by Google to communicate with the Google application that uses OAuth 2.0 protocol to call Google APIs. Client Secret Secret or passphrase that the portal uses to connect to and communicate securely with Google. API Key An API key generated by Google for each project and is used to communicate with other APIs enabled in the project. Extend User Profile Permissions Select the additional user details you wish to select from the user profile on Google, which includes Email Address. The user is notified whether he would like to share the requested information (basic and additional details). If the user denies the request, the login fails. Restrict login to Google Hosted Domains Select it to restrict the portal to users with accounts in the Google Hosted domains. - Configure the QoS Settings.
- Click Save.
Configure Foursquare Plugin
Configure the Foursquare plug-in to enable guest authentication through Foursquare accounts.
To configure the Foursquare plug-in, perform the following steps.
- Click Portals.
- Click the portal name for which you want to configure the Google plug-in.
- Click the Plugins and QoS tab. Under the Social section, select the Foursquare icon to enable the Foresquare plug-in for the portal.
- Provide the Foursquare plug-in information.
Field Description Client ID Identifier provided by Foursquare to communicate with the Foursquare application that uses OAuth 2.0 protocol to call Foursquare APIs. Client Secret Secret or passphrase that the portal uses to connect to and communicate securely with Foursquare. - Configure the QoS Settings.
- Click Save.
The Foursquare plug-in configuration data is displayed on the Foursquare page of the selected portal.
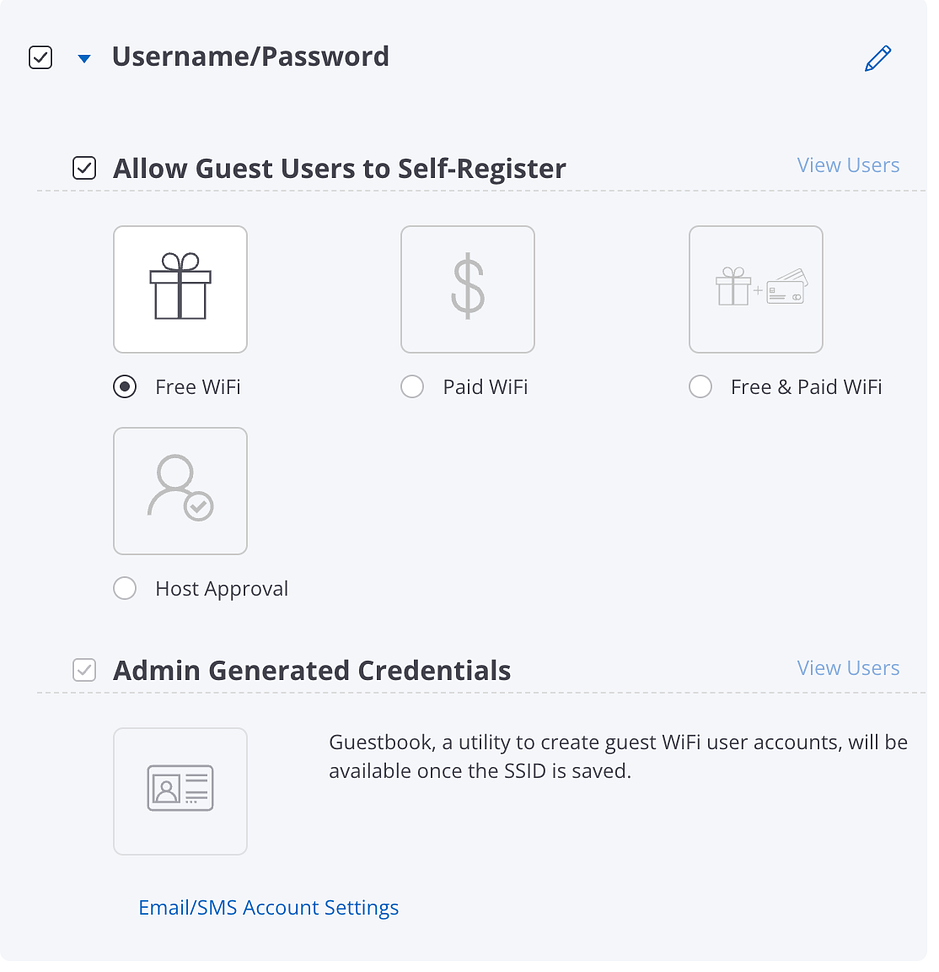
Configure Username/Password Plugin
With the Username/Password plugin, you can allow users to self-register or have them use Guestbook, i.e., admin-generated credentials.
To configure Username/Password plugin:
- Click Portals.
- Click the Plugins and QoS tab.
- Select Username/Password Plugin and click the edit icon (pencil) to edit settings.
- Select login method for guest WiFi users.
- To let users self-register, select Allow Guest Users to Self-Register.
Select Free Wi-Fi to allow free Wi-Fi access to users. Click on the "gift" icon to configure the free Wi-Fi. With free Wi-Fi you can:
- Allow self-registered users to set password
- Enable Forgot Password Link
- Allow guest users to activate an expired account
- Allow self-registered guest users to auto-login
- Show credentials to a self-registered guest user on a webpage
Select Paid Wi-Fi to have users pay for Wi-Fi access. Click on the "$" icon to configure paid Wi-Fi. With paid Wi-Fi, you can do all of the things listed in free Wi-Fi above, such as allow self-registered users to set password, enable forgot password link, etc. Additionally, you can define Payment Tiers for a payment gateway to bill users. To define Payment Tiers:
- If you have not yet configured a payment gateway, you must do so before you can proceed any further. Click Configure to set up a payment gateway. See Configure Payment Gateway Settings for details.
- Select Currency for payment.
- Click the "+" icon to Add Tier.
- Configure the Amount, and the access Duration for this amount.
- Enter the Email Content you want to include as part of the paid Wi-Fi welcome message.
- Enter the SMS Content you want to include as part of the paid Wi-Fi welcome message.
Select Free & Paid Wi-Fi to offer users free access for some time and then charge them. The configuration is essentially a combination of the items in the free Wi-Fi and the paid Wi-Fi cases. The only additional task is that you need to define the initial period for which the Wi-Fi is free and how often you want to renew this free period.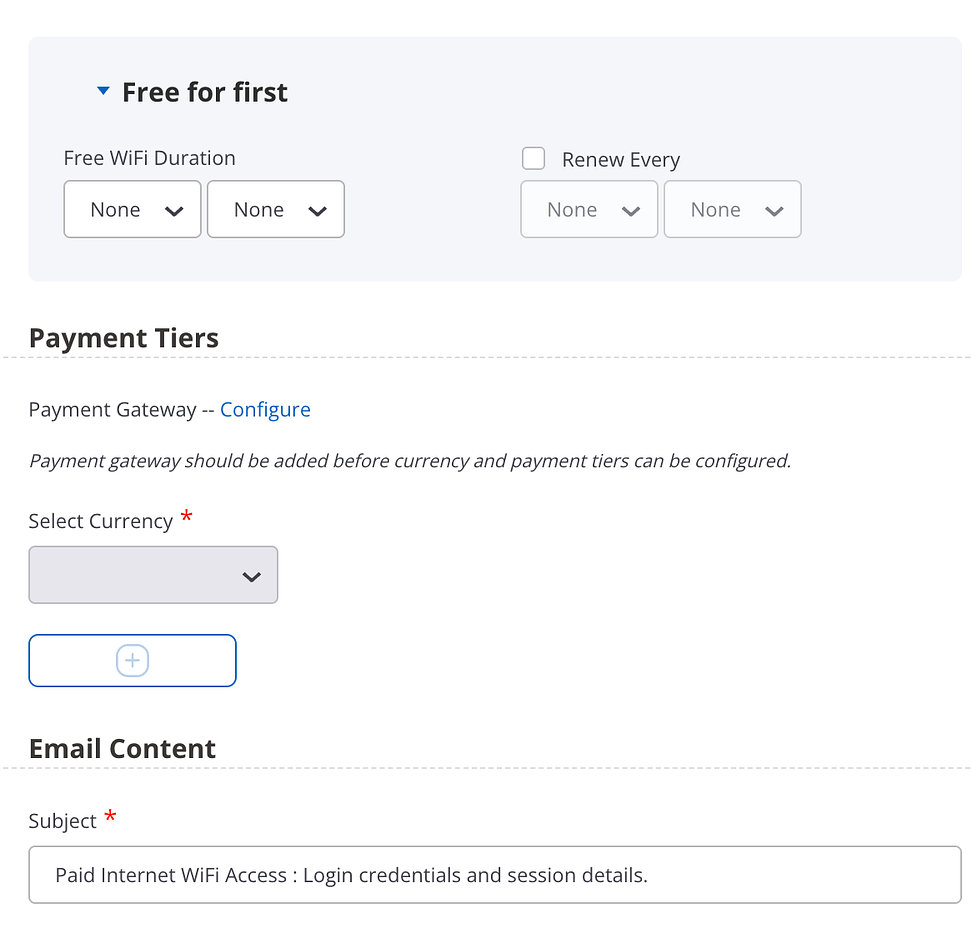
The steps for this task are:-
- Expand the Free for first option.
- Enter the Free WiFi Duration.
- Select Renew Every and enter the period after which you want to renew the free access.
-
Note: Some scripts from the payment gateway do not load in Android native web view (i.e. the native browser that Android uses). To avoid this, you must add ssl.gstatic.com to the Walled Garden list of the captive portal. if you do not add this entry to the Walled Garden, the user sees an error message saying that the page could not be loaded and asking them to use a different browser.
- Select Host Approval for users to request host approval vie email.
Click on the host approval icon to configure the Host Approval Settings. For host approval settings:
- Enter the Email domains to receive approval requests for guest access. With this you can ensure that requests are only sent to authorized domains.
- You can define approvers by entering Approver Email Addresses.
- Allow host to approve Wi-Fi access for guest
- Allow guest users to skip host's email on splash page
- Allow self-registered guest users to auto login
- Show credentials to a self-registered guest user on a webpage
- To let users self-register, select Allow Guest Users to Self-Register.
- To use a Guestbook to authorize logins, select Admin Generated Credentials.
- Click on the Guestbook icon.
- Click Save.
- Click Save on the Plugin & QoS page to save the plugin settings.
Note: You can use the Guestbook icon only after you have saved the SSID.
Info:This opens a new Guest Manager tab in your browser, where you can define new guest Wi-Fi accounts.
Configure Passcode through SMS Settings
In this method, users provide their mobile numbers and receive a passcode for Wi-Fi access via SMS.
To configure Passcode through SMS:
- Click Portals.
- Click the Plugins and QoS tab.
- Select Passcode through SMS Setting and click the edit icon (pencil) to edit settings.
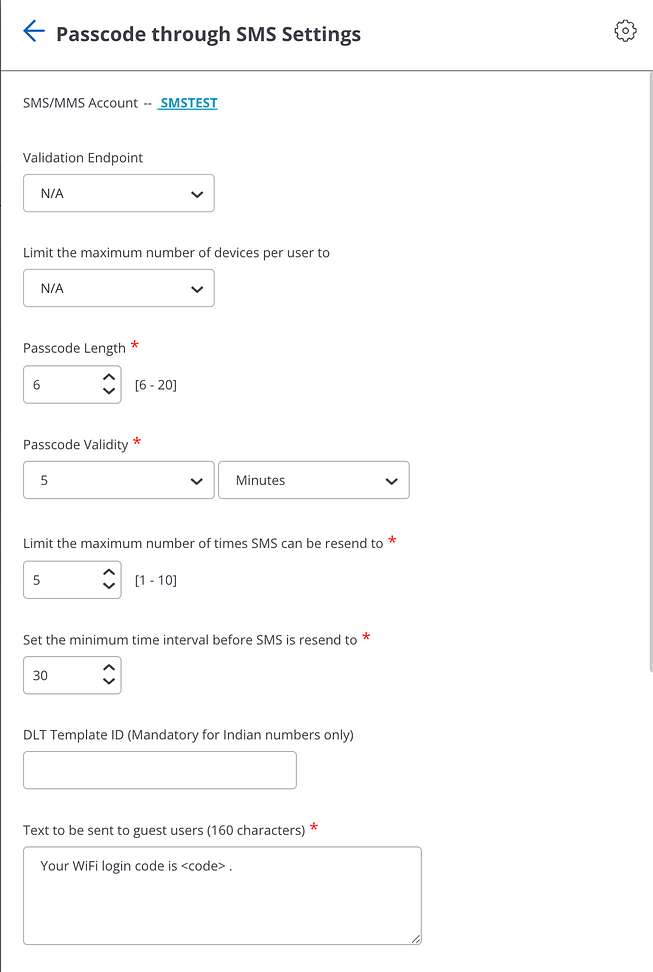
- Select your SMS/Account.
- Select the Validation Endpoint.
- Select the limit for the maximum number of devices per user.
- Select the Passcode Length and the Passcode Validity.
- Select the parameters for re-sending the SMS:
- the limit for the maximum number of times you want the SMS to be re-sent
- the minimum time interval that must elapse before an SMS is re-sent.
- Enter the text to be sent to guest users in the SMS.
- Enter the DLT Template ID. The DLT Template ID is provided by the SMS service provider.
- Configure the Quality of Service settings
- Click Save.
Configure Webform Plug-in
Webform is an enhanced form of clickthrough. There is no authentication, but users fill out their details such as name, email, and contact number.
To configure Webform plugin:
- Click Portals.
- Click the Plugins and QoS tab.
- Select Webform and click the edit icon (pencil) to edit settings.
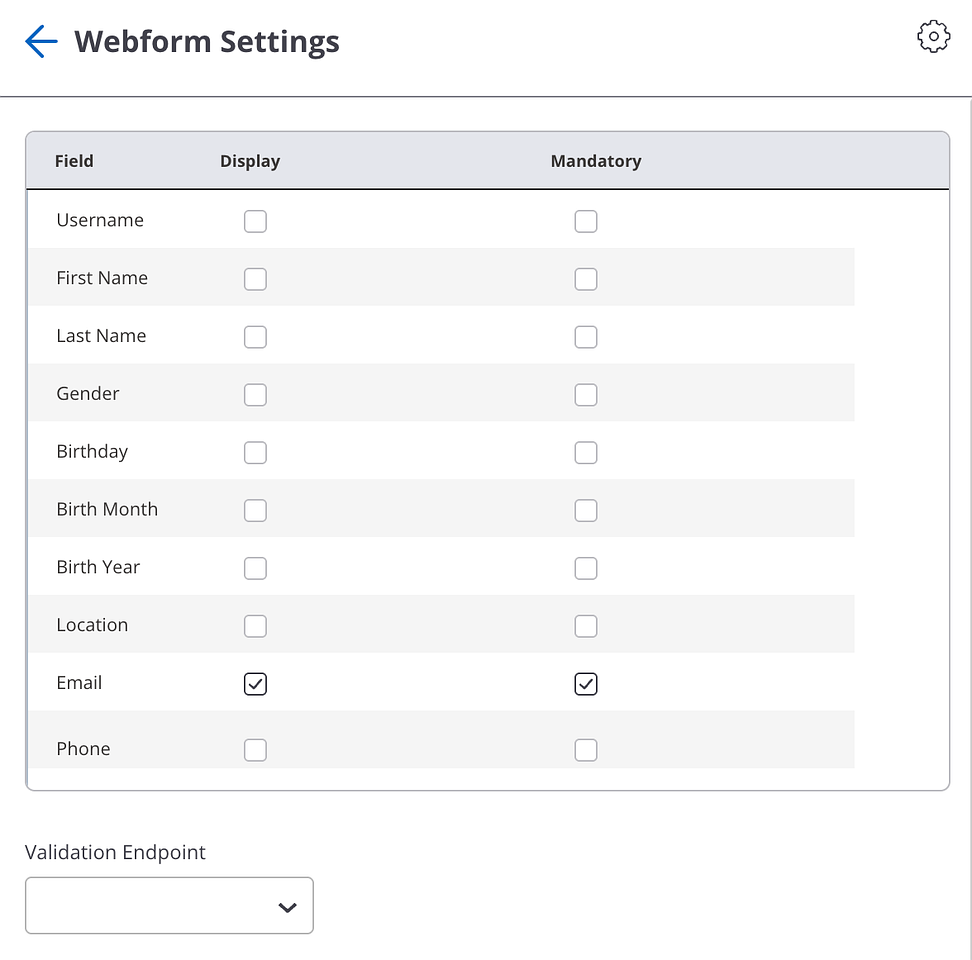
- For each Field (e.g. First Name), select whether you want to Display the field on the webform and whether you want the field to be Mandatory.
- Select the Validation Endpoint.
- Configure the QoS Settings and click Save.
Configure Custom plug-in
Arista offers 2 custom plug-ins:
- SAML
- OpenID Connect
Configure SAML Plugin
You can integrate SAML SSO with a captive portal for authentication.
Note: The SAML integration functionality is only available for captive portals hosted on the Arista Cloud. It is not available if the captive portal is hosted on third-party servers or on the access point.
To configure SAML:
- Click Portals.
- Click the Plugins and QoS tab.
- Select Custom checkbox and click SAML icon.
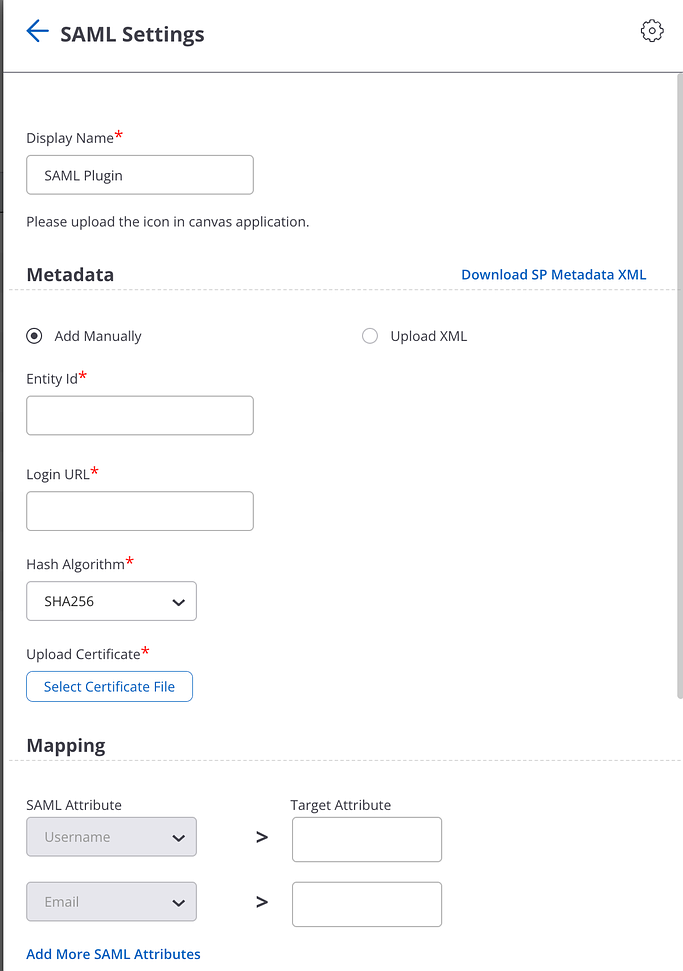
- Provide the display name. Users will see this name on the splash page.
- (Optional) Upload a logo for the SAML icon in the canvas application.
- Click the Download SP Metadata XML link and share the downloaded metadata with the identity provider.
- Provide the metadata information received from your IDP Vendor. You can add the metadata manually or upload an XML with all the metadata details. To add metadata manually, provide this information:
- Entity ID — The ID of the SAML SSO identity provider (IDP).
- Login URL — The URL of the IDP application.
- Hash Algorithm
- Upload Certificate — Certificate used by the IDP to sign or encrypt the data.
To upload the metadata, click Upload XML and upload the XML file from your local or shared drive.
- Provide a mapping between SAML attribute and target attribute. The SAML attributes are predefined attributes that users see on the UI. The Target attributes are attributes defined by the identity service provider.
- Configure the QoS Settings and click Save.
Configure OpenID Connect
You can integrate OpenID Connect with a captive portal for authentication.
- Click Portals.
- Click the Plugins and QoS tab.
- Select Custom checkbox and click OpenID Connect icon.
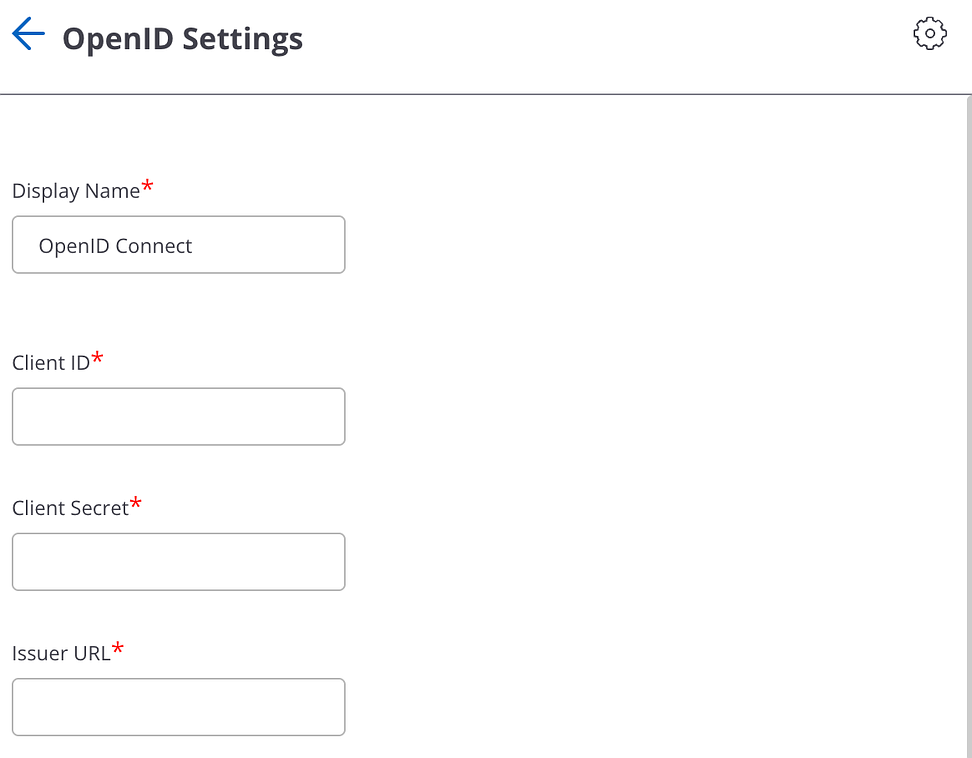
- Provide the Display Name.
- Specify the login details for the OpenID Connect account:
- Client ID — The client ID or login ID of your OpenID Connect account. It is used to identify your application on IDP.
- Client Secret — The password of your OpenID Connect account. Client secret ensures that the access tokens are granted to authorized applications only. By adding the client secret in SSID settings, we ensure that our application is considered as authorized by the IDP.
- Issuer URL — The URL of the OpenID server. This is the landing page url of the IDP. The user gets to the sign-in page through this URL.
- Configure the QoS Settings and click Save.
Configure External RADIUS plug-in
With the RADIUS plug-in, guest users can obtain access to the Wi-Fi network using their username and password, which are configured on a RADIUS server.
With the RADIUS plug-in, guest users can obtain access to the Wi-Fi network using their username and password, which are configured on a RADIUS server. The RADIUS server authenticates guests and informs the Access Point about the successful login.
Note: To configure the Radius plug-in on the portal, you must have an administrator role.
- Click Portals.
- Click the Plugins and QoS tab.
- Click the External RADIUS checkbox to enable the RADIUS plug-in for the portal.
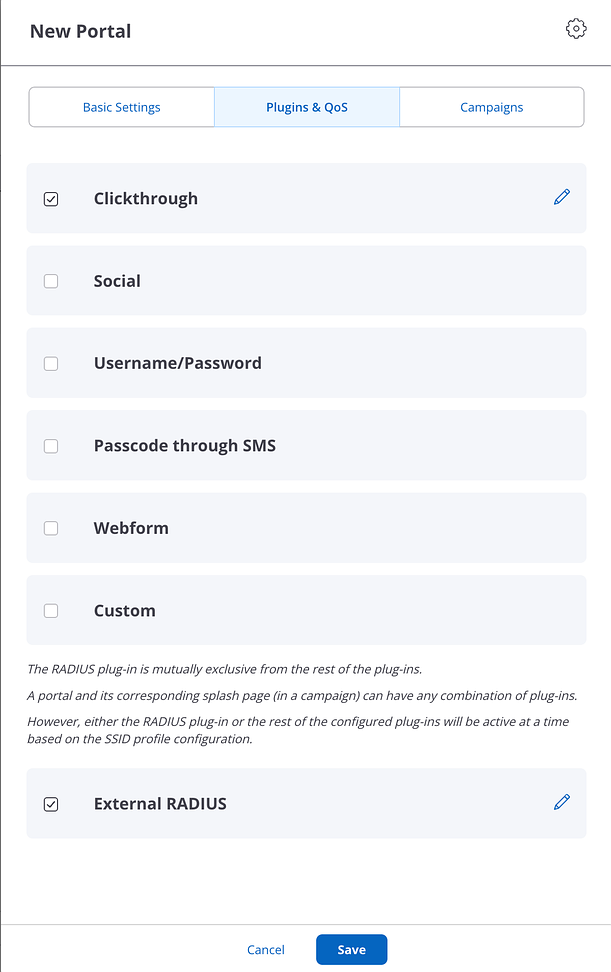
The RADIUS plug-in does not require any further configuration. RADIUS plug-in is shown on the splash page, only if you have configured the RADIUS settings in the Captive Portal section of the SSID profile, else the other configured plug-ins are shown on the splash page. The RADIUS plug-in is mutually exclusive from the other plug-ins. - Configure the QoS Settings and click Save.
Campaigns
After you create a portal and configure the plugins on it, you must configure the portal to ensure that your custom login page, the portal splash page, is displayed when guest users access the portal.
A campaign is the container for splash pages and landing pages designed using Canvas. You must associate an appropriate campaign with the portal so that the splash page published in the campaign is associated with it.
Creating and managing splash pages is done through the Canvas app.
Create and Manage Campaigns
- Navigate to .
- Click New Portal.
- Configure the Plugins and QoS settings.
- Click the Campaigns tab.
- Click Manage Campaigns to navigate to the Canvas app.
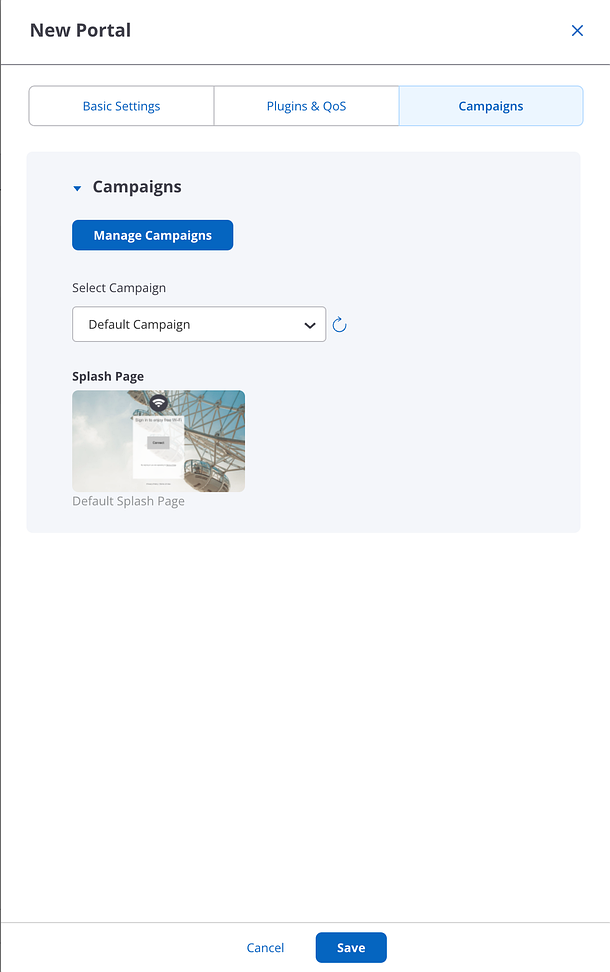
The canvas app enables you to create campaigns and add guest authentication and engagement content to the campaigns. Design your splash and publish your campaign. - Select your campaign to assign it to the portal. You can preview your designed splash page before adding it to the portal.
- Click Save.
The published splash page of the campaign is associated with the portal.
Note: If the splash page published in the selected campaign contains plug-ins that are not configured on the portal, the plug-ins will not work, and guest Wi-Fi users might see an error. You must manually configure the required plug-ins for the portal to ensure an error-free guest Wi-Fi user experience.
Common Settings for Engage Portals
Along with creating a portal, configuring plugins and QoS settings, creating and managing campaigns, you need to configure the three common portal settings.
You can configure the following common settings by clicking the gear icon on the top panel:
Email Account
This is the email account used to communicate with your Wi-Fi users.
- Click the gear icon for Common Settings.
- Click the envelope icon for Email Account.
- Select the Email Service Type.
- If you select System Email:
- Enter the From Email ID and the From Name. These will appear in the "From" field of the email the user gets.
- Enter the Return Email ID. This is the email ID to which the user can send a response. You can test by clicking Verify to receive a test message on the return ID.
- If you select SMTP Configuration:
- Enter the From Email ID and the From Name. These will appear in the "From" field of the email the user gets.
- Enter the Return Email ID. This is the email ID to which the user can send a response.
- Enter the SMTP Server Host name or IP address.
- Enter the Server Port number of the SMTP server.
- Select the Login Method for the SMTP server.
- Enter the Login Username and the Login Password for the SMTP server.
- Select the Connection Security type for the connection to the SMTP server.
- You can enter a Test Account and click Send Test Email to verify that the configuration works.
- Click Save to save the configuration.
SMS/MMS Account
This is the SMS / MMS account used to communicate with your Wi-Fi users.
- Click the gear icon for Common Settings.
- Click the message icon for SMS / MMS Account.
- Under the Account option, select an existing account or select Add New to add a new account.
- Provide an account name.
- Select a Service Provider.
Info: You can select Twilio, Msg91 or a custom service provider. The configuration varies depending on your choice.
- If you select Twilio, enter the Account SID, the Auth Token and the Twilio Number.
- If you select Msg91, enter the Username, Password, and Sender ID, and select the SMS Route.
- If you select Custom, enter the Service URL.
- Enter a Test Account number, provide the DLT Template ID, and Test SMS Settings to verify that the configuration works.
- Click Save to save the configuration.
Configure Payment Gateway Settings
This is the payment gateway used to bill users when you select Paid or Free + Paid Wi-Fi.
Arista currently supports only the Stripe payment gateway.
To configure payment gateway account settings:
- Click the gear icon for Common Settings.
- Click the two coins icon for Payment Gateway.
- Under the Stripe Account option, select an existing account or select Add New to add a new account.
- Enter a Name for the account.
- Open the Stripe website in a new tab and login to your Stripe account.
- On the Stripe home page, click API on the left navigation menu.
Note: If you were already logged in to Stripe, you need to logout and log back in to be able to access the API menu.
- Copy the Live Publishable Key and the Live Secret Key from the Stripe API menu, and paste them in the respective fields in the payment gateway settings in CV-CUE.
- Click Save to save the configuration.
Create Reports
You can create one or more custom reports for a location floor. Each report can have segments with different filter criteria. A custom report can have one segment with a Dashboard section, one segment with a Floor Maps section, and one or more segments with the remaining sections.
The Demographics, Presence, Engagement, and Wi-Fi Usage sections can be repeated in a custom report with different filters applied to each of the repeating sections.
- Navigate to tab.
- Select the location for which you want to create the report.
- Click New Report.
- Enter the report name.
- Click the Add icon to add a new segment.
- Select the section, chart, and duration.
- Select the appropriate option from any other filters that appear.
- Repeat steps 5 through 7 to add new segments to the report.
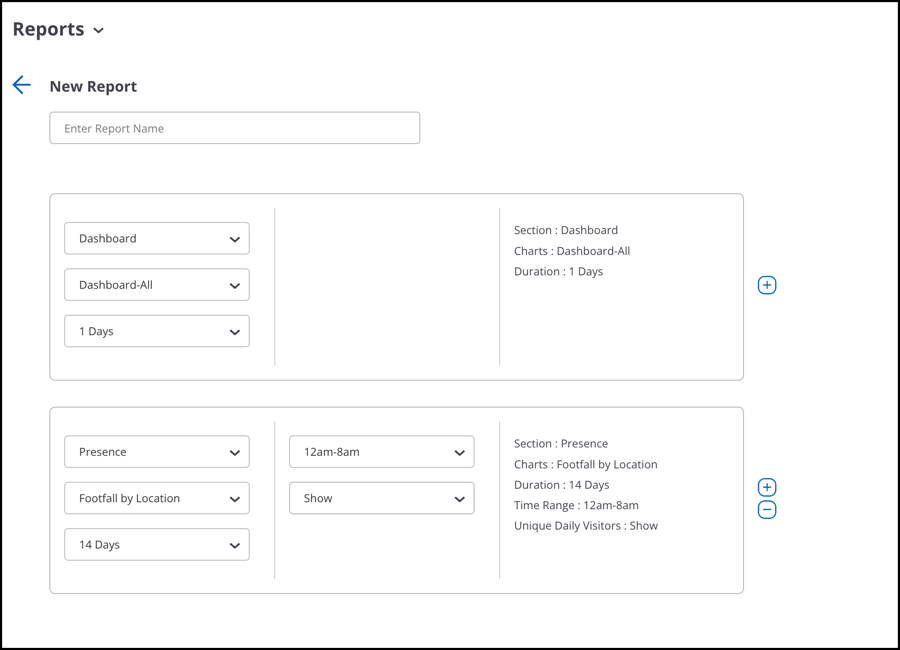
- Click Save.
Once a report is saved, you can schedule it from the Reports Listing page.
To schedule a report:
- Go to
- Select Schedule from the three-dot menu next to your saved report.
- Provide schedule details.
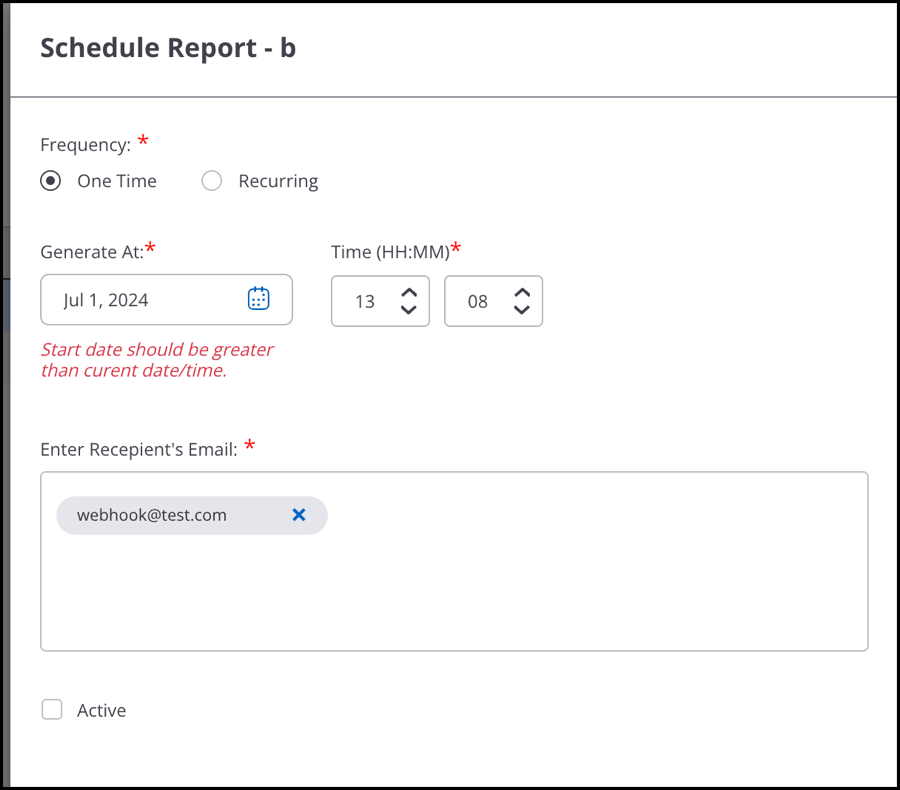
- Click Save.
You will receive the generated report in the provided recipient’s email. To generate a report in pdf format instantly, click Download from the three-dot menu and provide the date for the report.
Admin Settings
Third-Party Integration
You can configure Third-Party Endpoints to receive Notifications when a guest user connects to the Wi-Fi or to Validate the request for accessing the guest Wi-Fi. An endpoint is a destination, say a service running on a server, to which the guest profile information is to be sent. When you configure the endpoint, you specify the destination URI, the HTTP method to use for data transfer, and the information (key-value pairs) to be sent to this endpoint.
CV-CUE provides a predefined set of values for a guest profile based on the information it captures. The individual fields in the guest profile information can be mapped to relevant keys or field names in a third-party application. Keys are the identifiers derived from the third-party application to which you want to associate this information to form a key-value pair.
After you define the endpoints, you must configure them in the respective plug-in QoS on the portal. This helps in sending the requested key-value pairs to the appropriate endpoint when a user authenticates from the portal splash page using the plug-in.
- Notification Service
- Validation Service
The notification service occurs after the user logs in to the server, while the validation service happens when the user tries to connect to the server to gain access to the guest Wi-Fi.
Notification Service
By configuring an endpoint with a Notification service, you can send real-time guest profile information to third-party applications as soon as a guest user accesses a portal and successfully authenticates using one of the plug-ins defined on the portal.
This works for all the plug-ins like SMS, Guestbook, Facebook, LinkedIn, Google, Twitter, Foursquare, Instagram or Clickthrough. The third-party application can store it for future use. This information is sent in the form of key-value pairs and can be stored in any desired format, JSON, XML, or in a database by the third-party application. The information sent to the third-party plugins can be different for different plugins.
Validation Service
By configuring an endpoint with a Validation service, you can add an extra step for validation to secure the Wi-Fi access granted to guest users. The validation is needed to allow only authenticated users to have access to the Wi-Fi.
How does validation work?
The authentication process is done by specifying certain primary parameters which will perform the authentication process. In case of the SMS plugin, we need a valid phone number of the user which will receive an OTP or any authenticated code that will validate the user. This can be a combination of two or more than two parameters.. It depends on the customer and its customized splash page.
For example, if a user logs in to the portal and needs to access the guest Wi-Fi in a particular office area. He is then asked to provide a valid phone number and an insurance id. These two unique primary factors define the user and the information is sent to the server. The server then sends an OTP via SMS plug-in to the user's phone number. Once the details have been put in, the authentication process takes place and a corresponding success or failure message is sent based on which the guest user can log in.
Configuring an Endpoint for Third-Party Integration
You can add endpoints for third-party integration. The guest profile information can be sent to the endpoint using the HTTP GET and HTTP POST methods or the redirect method. You can send guest profile information that is collected by Guest Manager and custom data where you can specify your own key and corresponding value for the key.
When adding an endpoint, you must enter at least one notification parameter for the endpoint. If you select the parameter type as Guest Manager, you must select a value from the predefined list of values.
If you select the HTTP GET method or redirect, the key-value pairs are appended to the endpoint URL. If you select HTTP POST, the key-value pairs are sent as encoded form-data. A Notification Preview is presented on the bottom of the page as you enter the key-value pairs. This is a preview of the actual form in which the data will be sent to the third-party application using an HTTP request. The Validation Preview has a header tab and request body. The request body parameter generates only when the call is POST Call and for SMS plugin specifically.
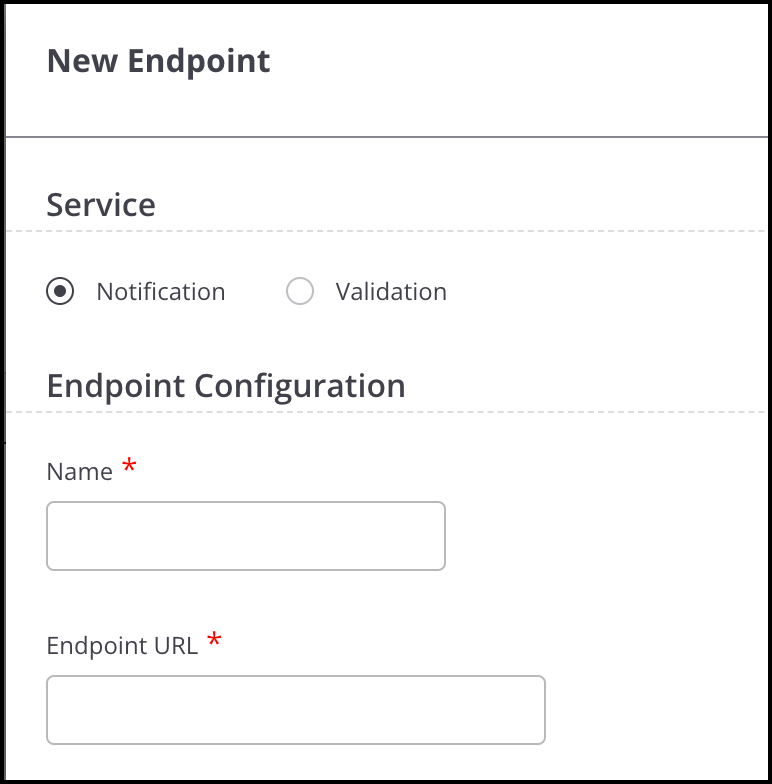
- Navigate to
- Click New Endpoint.
- Provide the endpoint details:
Table 2. End Point Details Field Description Service The service type can be either Validation or Notification. Name A user-defined name of the endpoint. End Point URL The URL of the endpoint. This is URL to which the key-value pairs will be sent. This could be a service listening for requests and handling the incoming key-value pairs. Description An optional description of the endpoint. Method Type You can select only one method for an endpoint. Select GET, POST, or Redirect option. If you select the HTTP GET method or redirect, the key value pairs are appended to the endpoint URL. If you select HTTP POST, the key-value pairs are sent as encoded form-data. If you select the Redirect option, you must select the third-party endpoint as the Redirect URL in the respective plug-in QoS tab of the portal. Response Timeout The timeout, in seconds, for which CV-CUE keeps the data in its cache for sending it to the endpoint. After the timeout period, the data is deleted from the cache. The default value is 10 seconds. Response timeout can have a maximum value of 60 seconds. Retry Count This is an integer value that specifies the number of times server will try reconnecting to the third-party server. The maximum retry count is 3. Notification Preview Preview the Requested URL and encoded form data. - Select Request Body as Form Data. Click Add new row to add Parameters as specified in the following table. Repeat this step to add multiple parameters.
Field Description Parameter Type The type of parameter to pass to the third-party application. Select Guest Manager if you want to pass a parameter captured by the Guest Manager. To send custom key-value pairs, select the Custom option. You can include a mix for Custom and Guest Manager notification parameters. Key The key name to which the corresponding value will be associated. You can define key names that map with the appropriate fields or attributes defined in the third-party application. Value The parameter to pass to the third-party application. For a Guest Manager parameter, select a predefined value from the drop-down list that will be mapped to the corresponding key. If the parameter type is Custom, you can enter any string here. - For POST operations, you can also define the parameters through the Raw Body section where you can define the JSON parameters in parentheses. The possible values for the parameters are:
portal_name visit_count birth_day email ap_mac private_data friends_count languages first_name plugin_name last_visit birth_month gender ap_ssid membership_id followers_count location last_name client_mac date_created phone_number picture_url username marketing_option birth_year login_location age_range - Click Done.
While CV-CUE tries to connect with the third party and fails to receive a response, it submits the request again after trying for the specified response time. The server can retry to establish a connection, but the maximum number of retries is only 3. There is no retry for failure in connection establishment.
View Logs
You can use logs to analyze usage pattern of the Wi-Fi as well as the actions performed on your account.
- Audit Logs
- Guest Wi-Fi Access Logs
- SMS Logs
- Payment Logs
- Navigate to
- Select Log Type. You can select from:
- Audit Logs: Audit logs provide information about the Guest Manager user activities. Audit logs are available for the past 365 days. They contain the following information:
Table 3. Audit Logs Field Description IP Address IP address of the computer device from which the operation was performed. Operation Type Type of operation. The operation types logged are Create, Read, Update, Delete, and Other. Some operations, such as login and logout, are categorized as Other. Operation Performed Details about the performed operation. Date/Time Date and time of the operation. Username Username of the CV-CUE user who performed the operation. Role Role of the user who performed the operation. Portal Name Name of the portal for which the operation was performed. - Wi-Fi Access Logs: You can download access logs for a particular portal. Wi-Fi Access Logs contain the following information:
Table 4. Wi-Fi Access Logs Field Description Portal Name of the portal accessed by the guest user. Type Type of access operation. This indicates whether it is a login, logout, portal access or gate access. Portal access entry is recorded when the user accesses the portal. A gate access entry is recorded when the access point opens the gate for the user to access the Internet. Client Public IP IP address of the client used by the guest user to connect to the access point. Client Local IP If NAT is enabled, Client Local IP is from the IP Pool defined in the NAT configuration. If NAT is disabled, it is the same as Client Public IP. Client MAC MAC address of the client used by the guest user to connect to the access point. AP MAC MAC address of the access point used by the guest user to access Wi-Fi. AP IP IP address of the access point accessed by the guest user. AP SSID SSID of the access point accessed by the guest user. AP Port Port number used to communicate with the access point. User Agent User agent details of the browser used by the guest user to access Wi-Fi. User URL URL accessed by the guest user. Username The user account used to access the Wi-Fi, followed by the plug-in name. Message Provides gateway access and log-off URLs. Message also include session timeout, blackout time, download limit, upload limit, and the redirect URL configured on SSID. Date/Time Date and time of access by the guest user. - SMS Logs: SMS logs contain detailed information about which code was sent to which number and how many times, the last login status, and other information such as the client and AP MAC address. SMS logs are generated for the selected account. SMS logs contain the following information:
Table 5. SMS Logs Field Description SMS Account Name Name of the configured SMS account. Service Provider The service provider used to send the SMS. This can be Twilio, MSG91, or a custom service provider. Sender ID The Twilio number or short code configured or the MSG91 sender ID configured on the plug- in. Mobile No The mobile number provided by the guest for receiving the SMS with Internet access code. SMS Content Message content of the sent SMS containing the authentication code. Date Created Date of SMS code generation. Sender Component Sender Component could be SMS Test Health or SMS Authentication Plugin. SMS Test Health corresponds to the option to test out if the SMS App is working or not. SMS Authentication Plugin gets triggered through the Authentication workflow upon client connection. Other Other details such as SSID, Client MAC address, AP MAC address. - Payment Logs: Payment Logs contain detailed information about payment transactions. The following information is captured in payment log:
Table 6. Payment Logs Field Description MGM Transaction ID Transaction ID generated by MGM for every transaction. Payment Gateway Transaction ID Transaction ID generated by the payment gateway. Timestamp - Transaction Initiated Timestamp when the transaction with the gateway was initiated. Timestamp - Transaction Completed Timestamp when the payment gateway responds with a code. Status Internal MGM recorded internal status of the transaction. - Initiated
- Completed - Passed
- Completed Failed
- Timed out
Status - Payment Gateway Payment gateway generated status. Transaction Amount Amount value of Transaction Payment Tier Chosen by User The tier that the user chose while doing the transaction.
- Audit Logs: Audit logs provide information about the Guest Manager user activities. Audit logs are available for the past 365 days. They contain the following information:
- Select Custom to enter a custom date and time or select Last to generate logs for the last specified days, hours, or months.
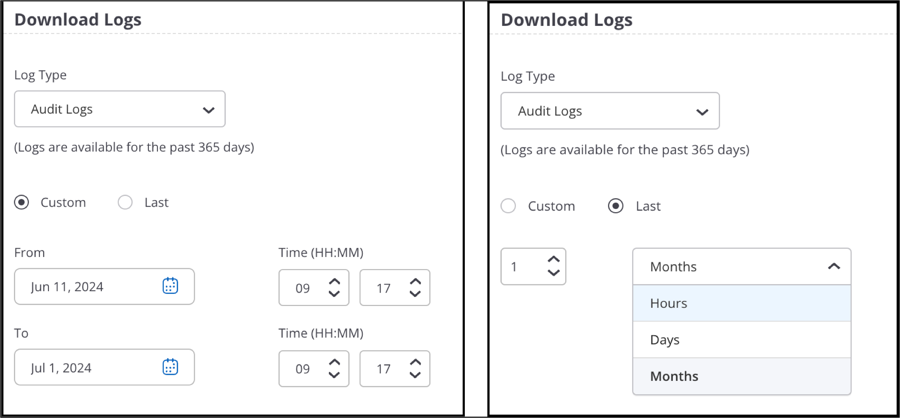
- Click Download.