Hosts
Managing Hosts in the ETM Dashboard
The Hosts view in the ETM Dashboard lets you view the Internet activity of host devices on your networks. You can view additional details of hosts that Webroot Endpoint Protection or Malwarebytes protect.
To view additional host details, you must configure a connection with the Webroot or Malwarebytes Cloud Management system. See Managing Endpoints Via Malwarebytes Integration and Managing Endpoints via Webroot Integration for more details.
This information is queried and updated daily.
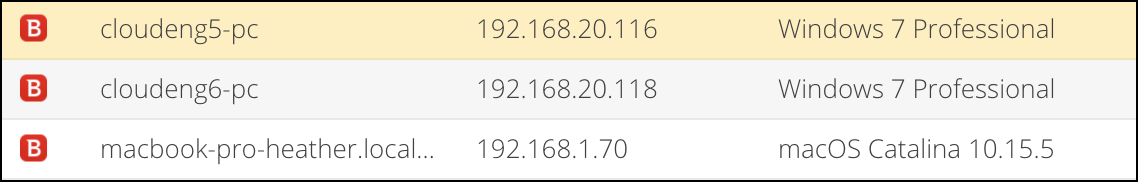
Viewing Hosts


- Endpoint Security Association icon
- Hostname
- IP address
- Mac Address
- Mac Address vendor
- Appliance
- UID
- Operating System
- Quota and Quota usage
- License entitlement
- Date creation
- Date updated
Click a specific host to view additional details.
Summary

Endpoint Security Details
The Endpoint Security tab shows details related to the endpoint security software, including the engine version and when it was last seen on the network.

Installed Software

Sessions
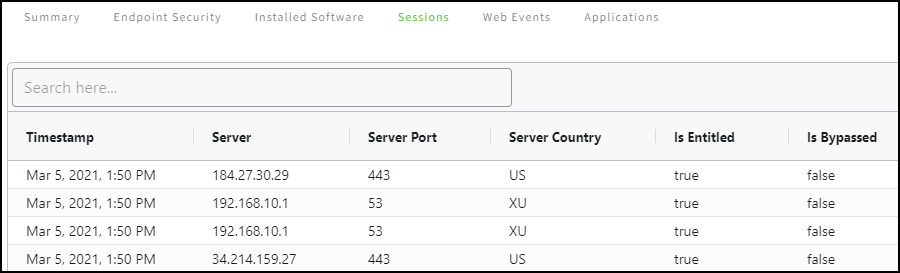
- Timestamp
- Protocol
- Hostname
- Client Port
- Server
- Server Port
- Server Country
- End Time
- License entitlement
- Bypass status
- Tags
You can hide columns and sort any details by clicking the three stacked horizontal lines at the right-hand side of each column header and choosing an action.
Web Events

- Timestamp
- Hostname
- Client Port
- Server
- Server Port
- Domain
- Host
- URI
- Method
- Category
- Blocked
- Flagged
- Reason

- Application - The detected application is based on the connection characteristics.
- Server - The IP address of the remote server.
- Server Country - The inferred location of the remote server is based on the IP address.
- Category - The application category.
- Confidence - A confidence level related to the accuracy of the detection.
- Details - Identifiable metadata associated with the network traffic.
- Sent - The amount of transferred data during the connection.
- Received - The amount of received data during the connection.
- Total - The total volume of transferred data during the connection.
- Is Bypassed - Was the connection excluded from app management?
- Is Blocked - Whether the connection was blocked.
- Is Flagged - Was the connection flagged?
- Tags - Any tags that may be associated with the connection.
Managing Endpoints via Bitdefender GravityZone Integration
The ETM Dashboard integrates with Bitdefender GravityZone to extend the host management capabilities in the ETM Dashboard. In the Hosts screen in the ETM Dashboard, you can see additional information about each host and perform specific actions.
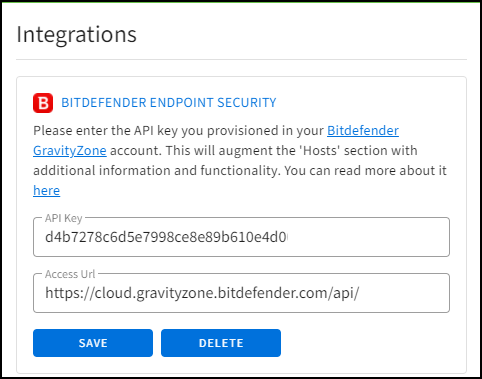
Connecting your GravityZone Account
- Access URL - The Access URL defines the region of your account.
- API Key - An API Key allows the ETM Dashboard to authenticate to your account to retrieve information about the endpoints you manage.
- Log in to GravityZone Control Center.
- Go to My Account.
- Under Control Center API, locate your Access URL.
- Under the API keys section, click Add.
- Choose Licensing API and Network API permissions.
- Click Save.
Configuring your API Key in the ETM Dashboard
- Log in to ETM Dashboard.
- Go to My Organization.
- Click .
- Enter your GravityZone Access URL.
- Enter your GravityZone API Key.
- Click Save.
Managing Endpoints via Webroot Integration
The ETM Dashboard integrates with Webroot Endpoint Protection to extend the host management capabilities in the ETM Dashboard. In the Hosts screen in the ETM Dashboard, you can see additional information about each host and perform specific actions.
Connecting your Webroot Account
Connect your ETM Dashboard account to your Webroot account to select Webroot integration. This requires a Parent keycode that you can locate in your Webroot account.
- Log in to your Webroot account and select your site.
- Navigate to .
- Copy the Parent Keycode.
After you obtain the keycode, you can set up your Webroot account connection in the ETM Dashboard.
To configure your Webroot account connection:
- Log in to ETM Dashboard.
- Go to .
- Enter your Webroot account credentials and the Parent keycode.
- Click Save.

After connecting your account, you can manage your Webroot endpoints in the Hosts screen.
Managing Endpoints via Malwarebytes Integration
The ETM Dashboard integrates with Malwarebytes to extend the host management capabilities in the ETM Dashboard. In the Hosts screen in ETM Dashboard, you can see additional information about each host and perform specific actions.
Connecting your Malwarebytes Account
To select Malwarebytes integration, you must connect your ETM Dashboard account to your Malwarebytes account.
- Log in to ETM Dashboard.
- Go to My Organization.
- Click Integrations.
- Enter your Malwarebytes account information.
- Click Save.

Managing Endpoints
