NG Firewall Manage Apps
Directory Connector
Directory Connector provides functionality to integrate with Microsoft's Active Directory or servers that support RADIUS Server, as well as some tools for managing the Host Viewer username mapping for the hosts on the network.

About Directory Connector
Directory Connector provides many tools to assist with Users.
Settings
This section reviews the different settings and configuration options available for Directory Connector.
Status
This displays the current status and some statistics.

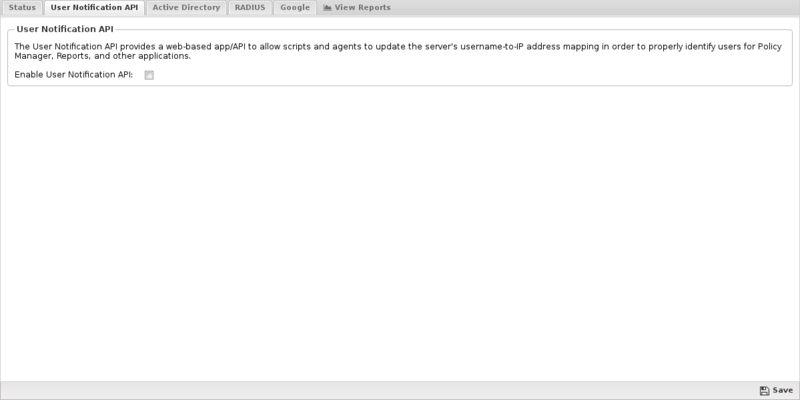
User Notification API
The "User Notification API" is a webapp running on the NGFW that various external scripts can call to notify NG Firewall that a specific user is logged into a specific IP. The userapi webapp is used to update and maintain the associated usernames in the Hosts so that User Matcher in Rules match correctly. When a username is associated with the Username in Rules matches as expected.
- manually
- via the User Notification Login Script
- via the Active Directory Server Login Monitor Agent
- via any custom script or external program
- Enable/Disable If enabled the User Notification API is enabled. If disabled, the User Notification is completely disabled.
- Secret Key: If specified, only API calls specifying the correct secret key will be allowed. All other requests are ignored. If not specified, it is not required to use the API however the clientIP argument is ignored to avoid API abuse.
| Argument | Example | Description |
|---|---|---|
| clientIp | 192.168.1.100 | The client IP address of the host in question |
| username | foobar | The username to associate with the client IP. |
| hostname | machinename | The hostname to associate with the client IP. This argument is optional. |
| action | login or logout | The action, login is assumed if no action is specified. login with associate the username and hostname of the specified client IP. logout will unset the client IP's associated username. |
| secretKey | foobarsecret | If this argument does not match the specified secretKey the call will be ignored. |
For example, If the NGFW internal IP is 192.168.1.1 without a secretKey, to associate user foobar on machine foobarpc to 192.168.1.100 you would call visit this URL: http://192.168.1.1/userapi/registration?action=login&clientIP=192.168.1.100&username=foobar&hostname=foobarpc&secretKey=foobarsecret.
To unset that username mapping when the client logs out simply visit this URL: http://192.168.1.1/userapi/registration?action=logout&clientIP=192.168.1.100&secretKey=foobarsecret.
Obviously visiting these URLs manually each time a user logs in or out of a machine is not realistic. Typically this process is automated in one of two ways described below or using a custom script.
User Notification Login Script
The User Notification Login Script or UNLS which is a small script that runs at login on each machine to notify the NGFW when a user logs in. This script can be pushed out to all the machines in a domain via a group policy object. This is useful in cases where you want to set the username in the Hosts without having users manually log into the Captive Portal.
Once installed, the script starts each time a user logs on to the network and immediately notifies NG Firewall of the username and IP address. Once this process is finished, any activity for that IP address will be automatically mapped to the username. This scripts runs on login and periodically in the background to keep the Directory Connector Username Map updated with any current information on your network users.
To download the User Notification Login Script, click on the Download User Notification Login Script button and download the script. The script will be configured for your environment but may require further customization. Review the script and make changes as needed.
Now that you have the UNLS on your Domain Controller, you need to decide if you want it run for UNLS for the Entire Domain or UNLS for Specific Users.
UNLS for the Entire Domain
- Click on the Download User Notification Login Script and save the user_notification.vbs file to \\localhost\\NETLOGON.
- Log on to the Domain Controller, then launch the Group Policy Management Console (: gpmc.msc).
- From the Group Policy Management Console, right-click on the domain and select Create and Link a GPO here.
- Specify a name for the Group Policy.
- Right-click on the group policy that you just created and click Edit.
- Go to .
- Click on the Logon icon, then Show Files. Windows Explorer will launch into the correct directory.
- Copy the user_notification.vbs file that you downloaded to this location.
- Click the Add button, browse for the script, then click OK.
- In the Logon Properties window, click Add , type a descriptive script name, then click OK.
- In the Select User, Computer or Group window, select the OU or Group to which you want to apply this GPO.
- From a command prompt, activate the group policy that you just created: gpupdate /force.
You can verify it is working by looking in the Event Log for login/logout events.
UNLS for Specific Users
If you only want to use the UNLS for a few users, you can use these instructions:
- Click on the Download User Notification Login Script and save the
user_notification.vbsfile to \\localhost\\NETLOGON. - Using a text editor, create a
local.batfile that has the following lines:
@ echo off
\\ADServerIPAddress\netlogon\user_notification.vbs
- Save the
local.batfile to \\localhost\\NETLOGON. - From the domain, go to the Users folder, right-click the user and go to Properties.
- On the Profile tab, type the filename of the UNLS (probably
user_notification.vbs) in the Logon script field. - Launch the Group Policy Management Console, then launch the Group Policy Object Editor (: gpedit.msc).
- Copy the
user_notification.vbsfile that you downloaded in the first step to this location.
Active Directory Server Login Monitor Agent
- It allows you to set a secretKey that only the agent knows, so only the AD server itself can update the username mapping. (users have no way of overriding changing the information)
- It is not necessary to run a login/logout script on all machines. No GPO is necessary.
First download and install the agent on the Active Directory server. and configure it so that it updates the NG Firewall server when it sees user login events.
Configure the NGFW Settings in Login Monitor so it updates your NG Firewall event when login events occur.
- Secret Key: The Secret Key if there is a Secret Key configured on the NGFW User Notification API. User Notification must be enabled on the NGFW. If no Secret Key is configured leave it blank.
- Prefix: The protocol to use to communicate with the NG Firewall.
- Port: The port to use to communicate with the NG Firewall. The default is port 80 for HTTP and 443 for HTTPS.
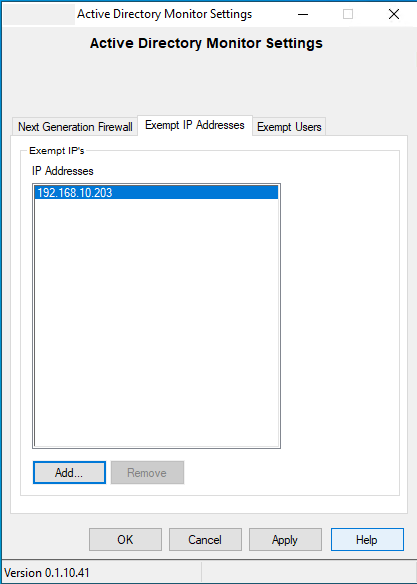
- IP Addresses: The IP addresses to reach your NG Firewall. Generally this should be the LAN addresses of your NG Firewall. By default HTTP and HTTPS is closed on the WAN side of NG Firewall. If the Login Monitor Agent cannot reach the NG Firewall, an error icon is shown next to the NG Firewall IP address entry.
Figure 5. Error Reaching NG Firewall 
- Single IP address (192.168.2.2)
- Wildcard IP address (192.168.3.*)
- CIDR (192.168.4.0/24)
- Range (192.168.5.5-192.168.5.102)
The Exempt Users tab is a list of AD users which Login show ignore for login events.
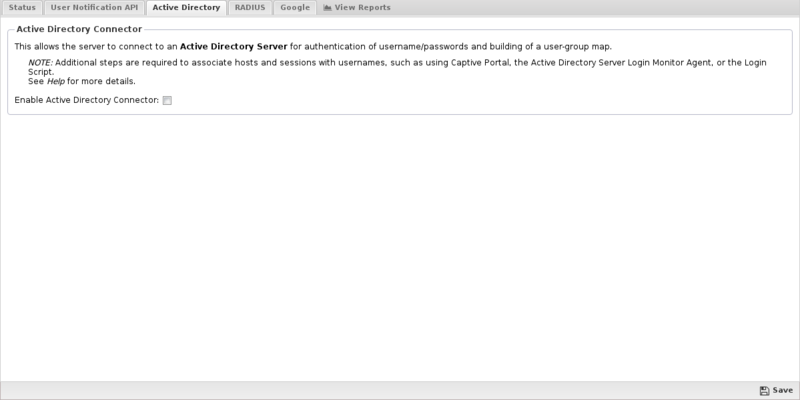
Active Directory
- Allowing users to login to Captive Portal using their AD login/password. The Captive Portal will verify the authentication information directly with the AD server.
- Allow NG Firewall to query the groups so the it knows which groups a user belongs to. If this is configured the rules matcher in Rules will correctly match.
- Ensure that your Active Directory users are in one domain. Users can be in multiple Active Directory Organizational Units (OUs), but must be under one domain - multiple domains are not supported at this time.
- Check to see if you have the Group Policy Management Console installed; if not, install it.
- AD Server IP or Hostname: The IP or hostname of the AD server - we recommend using the IP to prevent DNS issues.
- Secure: Enable SSL for the connection to the AD server.
- Port: The port to use when connecting to the AD server. The default is 389.
- Authentication Login: Enter an Active Directory Administrator login.
- Authentication Password: Enter an Active Directory Administrator password.
- Active Directory Domain: Your domain, (e.g. mycompany.local).
- Active Directory Organization: The Active Directory organization unit (OU) that contains the users. If you want the NG Firewall server to find all users, leave this blank.
If for some reason you want to limit the users to a specific part of the domain tree, specify the OU path in the format of OU=ouName. Only one OU can be entered.
Azure Active Directory
You can use the Active Directory Connector to authenticate users against Azure Active Directory Domain Services. This type of connection requires that you have a Microsoft Azure account using Azure AD Domain Services. Before configuring NG Firewall to authenticate to your instance of Azure Active Directory, follow these steps:
- Enable Azure Active Directory Domain Services
- Generate an SSL certificate
- Enable secure LDAP
- Permit access to secure LDAP
- Configure DNS for your AD domain
After you complete setting up Azure Active Directory, you can configure NG Firewall to authenticate via secure LDAP. The configuration of the connection is similar to a local Active Directory Domain except that you must enable the Azure checkbox. Confirm that the port is 636 and that Secure is enabled as Azure Active Directory requires secure LDAP.
RADIUS
The RADIUS Connector allows NG Firewall to communicate with a RADIUS server. This is useful for:
- Allowing users to login to Captive Portal using their RADIUS login/password. The Captive Portal will verify the authentication information directly with the AD server.
The RADIUS tab contains settings to configure communication with the RADIUS server.
- RADIUS Server IP or Hostname: The IP or hostname of the RADIUS server - we recommend using the IP to prevent DNS issues.
- Port: The port to use when connecting to the RADIUS server. The default is 1812.
- Shared Secret: This must match the shared secret set on the RADIUS server.
- Authentication Method: This must match the authentication method used by the RADIUS server.

Reports
The Reports tab provides a view of all reports and events for all sessions handled by Directory Connector.
This applications reports can be accessed via the Reports tab at the top or the Reports tab within the settings. All pre-defined reports will be listed along with any custom reports that have been created.
Reports can be searched and further defined using the time selectors and the Conditions window at the bottom of the page. The data used in the report can be obtained on the Current Data window on the right.
| Report Entry | Description |
|---|---|
| Directory Connector Summary | A summary of Directory Connector actions. |
| API Usage | The amount of login, update and logout user notification API events over time. |
| API Events | Events from the user notification API. |
Related Topics
Directory Connector Reports
The Reports tab provides a view of all reports and events for all sessions handled by Directory Connector.
Reports
This applications reports can be accessed via the Reports tab at the top or the Reports tab within the settings. All pre-defined reports will be listed along with any custom reports that have been created.
Reports can be searched and further defined using the time selectors and the Conditions window at the bottom of the page. The data used in the report can be obtained on the Current Data window on the right.
Pre-defined report queries:
| Report Entry | Description |
|---|---|
| Directory Connector Summary | A summary of Directory Connector actions. |
| API Usage | The amount of login, update and logout user notification API events over time. |
| API Events | Events from the user notification API. |
Related Topics
Reports
Reports provide users with detailed statistics of the traffic and activity on your network.

About NG Firewall Reports
These reports can be viewed online through the administration interface or the separate reporting interface available to non-administrators reporting-only users.
Customizable report summaries can be sent via email, which includes basic information and a link to view the online reports if the user has access.
Reports can backup your data in multiple formats to Google Drive for long term storage.
Settings
This section reviews the different settings and configuration options available for Reports.
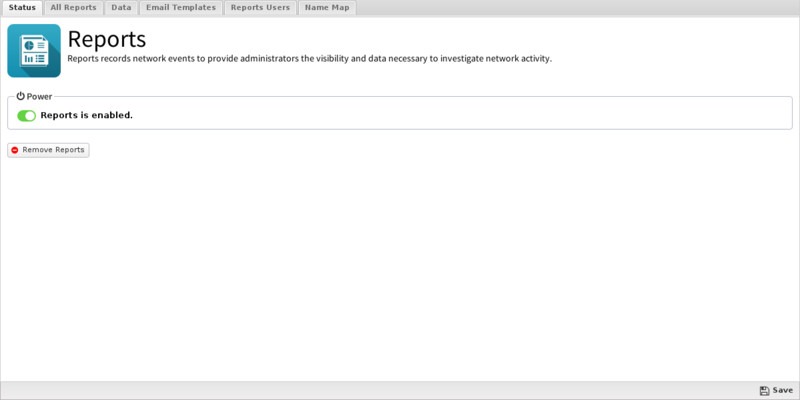
Status
You can click View Reports to open up Reports on this tab in a new browser tab.
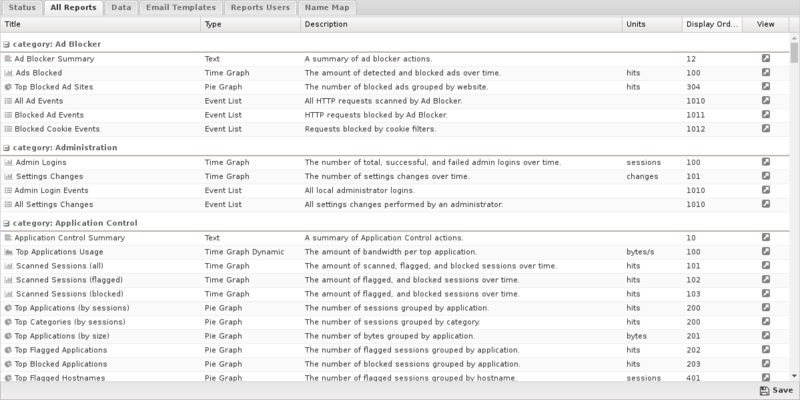
All Reports
This is the full list of all currently existing reports. This includes all the default reports and any custom reports that have been added.
To edit a report, click on View and then click on Settings.
To delete a custom report, click on View and then click on Delete.
To create a new custom report, click View on an existing similar report, then click Settings. Then, change the name and click Save as New Report.
To create a report from scratch, go to Reports and click on Create New in the lower left. When creating reports from scratch, each field must be carefully chosen and tuned until the desired data is provided. This process can be time consuming and difficult. It is suggested to work with a similar report to require the desired result. Additionally, you can ask for help via support or the forums and import the report if someone can craft it for you.
If creating a report from scratch, the settings and fields and their purposes are described below.
Report Entry
| Name | Value | Available | Description |
|---|---|---|---|
| Report Type | Text, Pie Graph, Time Graph, Time Graph Dynamic, Event List | The type of graph | |
| Title | Text | All | The report title |
| Category | Any existing category/application | All | The category in which the report is located |
| Description | Text | All | A brief description of the report |
| Text String | Text | Text | The text used to create the Text Report Type |
| Pie Group Column | Text | Pie Graph | The column to "group by" in top X charts (usually user, host, and so on) |
| Pie Sum Column | Text | Pie Graph | The column to sum in the top X charts (usually count, bytes, and so on) |
| Order By Column | Text | Pie Graph | The column to order by |
| Graph Style | Pie, Pie 3D, Donut, Donut 3D, Column, Column 3D | Pie Graph | The render style of the pie graph |
| Pie Slices Number | Integer | Pie Graph | The number of slices to display |
| Units | Text | Pie Graph | The units being displayed (usually bytes, sessions, and so on) |
| Graph Style | Line, Area, Stacked Area, Column, Overlapped Column, Stacked Columns | Time Graph | The render style of the time graph |
| Time Data Interval | Auto, Second, Minute, Hour, Day, Week, Month | Time Graph | The time aggregation unit or resolution |
| Approximation | Average, High, Low, Sum | Time Graph | The method used to aggregate/combine data points |
| Units | Text | Time Graph | The units being displayed (usually bytes, sessions, and so on) |
| Series Renderer | None, Interface, Protocol | Time Graph | The renderer used to display human-readable names |
| Dynamic Column | Text | Time Graph Dynamic | The column to select for/group by |
| Dynamic Value | Text | Time Graph Dynamic | The value to sort by and display |
| Dynamic Limit | Integer | Time Graph Dynamic | The number of series to show |
| Aggregation Function | Count, Sum, Min, Max | Time Graph Dynamic | The function used to aggregate by dynamic values grouped by dynamic column |
| Graph Style | Line, Area, Stacked Area, Column, Overlapped Column, Stacked Columns | Time Graph Dynamic | The render style of the time graph |
| Approximation | Average, High, Low, Sum | Time Graph Dynamic | The method used to aggregate/combine data points |
| Units | Text | Time Graph Dynamic | The units being displayed (usually bytes, sessions, and so on) |
| Series Renderer | None, Interface, Protocol | Time Graph Dynamic | The renderer used to display human-readable names |
| Colors | Color Picker | All | The color palette to use |
| Display Order | Integer | All | The integer used to determine the report's position in the category list |
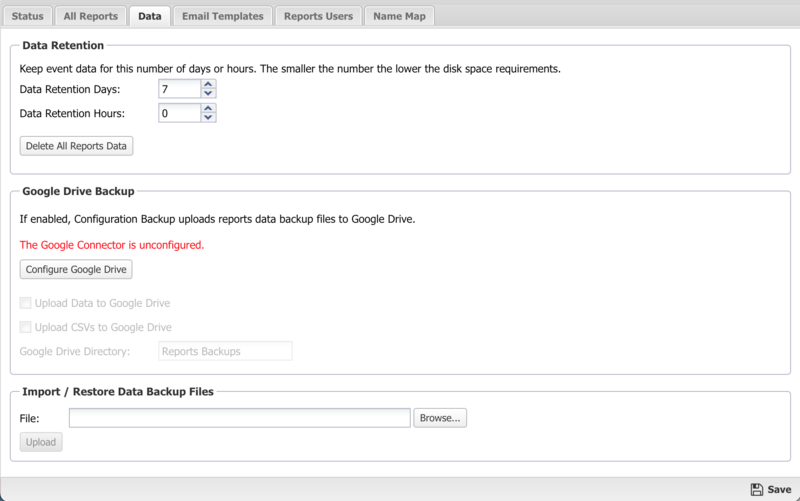
Data
- Delete All Reports Data: If you are running low on disk space and you wish to free space by wiping the reports database you can use this option.
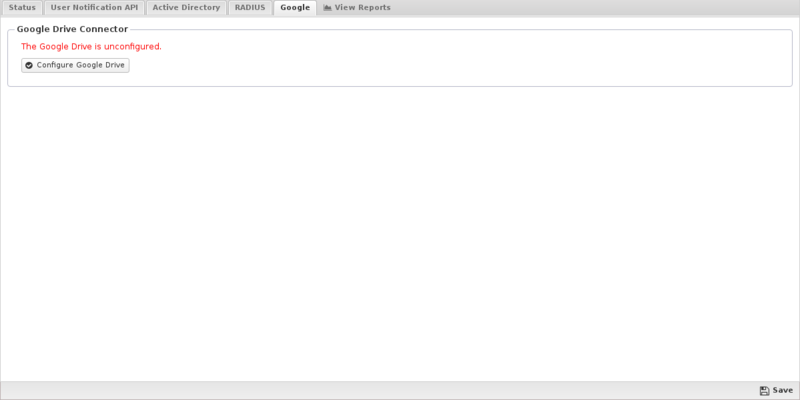
- Upload Data to Google Drive If enabled, and the Google Connector in Directory Connector is enabled, your daily data will be uploaded to google drive each night for safe storage.
- Upload CSVs to Google Drive If enabled, and the Google Connector in Directory Connector is enabled, your daily CSV files will be uploaded to google drive each night for safe storage.
- Google Drive Directory configures which subdirectory data will be uploaded to in google drive.
Email Templates
- Interval: Daily, Weekly, Monthly, Week to Date, Month to Date. The determines the time interval that the report will cover. Beware that enough data is available via the Retention settings to provide the data for the configured interval.
- Mobile: Generate chart images more appropriate for a mobile device.
- Reports: Select those reports under Config and Application sections. Text and chart reports are allowed but not event list reports. Reports for applications will be included only if that application is installed.
Additionally, you can copy the settings for an existing report.
The default Daily Reports template includes common text and chart reports for your system. This template is fixed and cannot be changed or modified.
Email Templates must be associated with Report Users.

Reports Users
- Email Address is the email address (and username) of the report user. Admin is a special case that determines if administrators will receive emails and alerts.
- Email Alerts determines if this reports user will receive email alerts.
- Email Reports determines if this reports user will received email report summaries.
- Email Templates determines which email report summaries this user will receive if Email Reports is enabled.
- Online Access if enabled, a URL to online reports is included in emailed report summaries for this user.
- Change Password changes the password for this reports user.

Name Map
You can use the Name Map to manually configure the hostname for hosts. NG Firewall often can automatically determine the hostname for the IP automatically via DHCP or other methods. You can view the current names for currently active hosts in the Hosts.

Accessing Reports
If a user is set up to receive email report summaries, they only need to view or download the HTML attachment to see an overview report. If they need more information or would like to drill down to specific users or machines, they can use the link in the email, which will open Reports on the NG Firewall if it is accessible from their location.
- Outside the NG Firewall network: Browse to the IP of the NG Firewall /reports using HTTPs, such as https://1.2.3.4/reports.
- Inside the NG Firewall network: Browse to the IP of the NG Firewall /reports, such as https://192.168.1.1/reports.
Note that to view Reports from outside the network you'll need to check Allow HTTPS on WANs at . If you have changed the External HTTPS Port, you'll need to use the proper HTTPS port when connecting from the outside.
Report Viewer
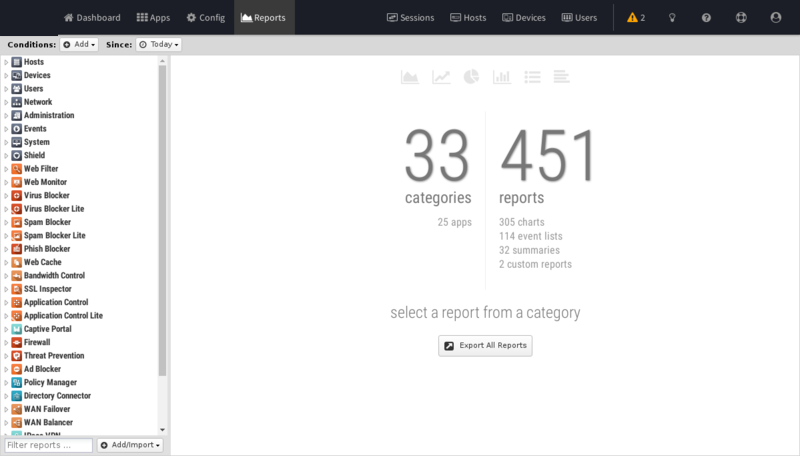
Reports provide a graphical view of the network traffic and actions of your NG Firewall. Various reports are available within applications and base system components. The reports can be manipulated to drill down, customize, and export data in many ways using the Report Viewer.
- The top panel: This top panel (just below the navigation menu) allow you specify which data is viewed. By default, there is just a timeframe and no conditions, so reports will show all data for the specified timeframe. Conditions can be viewed to view more specific data, such as a specific host, user, domain, application, web category, etc.
- The left panel: This allows you to choose the report you wish to view. At the bottom you can use the search box to quickly find reports with the specified string in the title. You can also import and create new reports using the "Add/Import" button.
- The chart panel: This panel shows you the specified report. It also includes several action buttons at the top.
- The data panel: The data panel, hidden by default, can be displayed by clicking on the Data View button in the chart panel. This will show the raw data used to generate the chart and allow the user to export the data by clicking the Export Data button at the bottom.
Conditions
The Conditions panel appears at the top panel and can be used to filter data displayed in reports. For example, to view a "specific" host's report, you can add a condition for Client = "192.168.1.100" and then all reports available will only show data where the client is 192.168.1.100. Multiple conditions can be added to drill down and inspect data. Conditions can also be added quickly by clicking on slices in pie charts.
Condition Operators
The second field in the condition is the logical operator that will be used in evaluating the condition value defined in the last field. In most use cases the default "=" operator is what you want to use. However, there are several other operators available that make the reports and alerts a whole lot more powerful.
Conditions Example - Policy by Policy ID
- In the Conditions panel, select Add.
- Choose Policy ID and specify equals and the policy ID in question.
- The conditions is applied and will remain applied as you switch between reports.
Conditions Example - Web Filter Categories
- Open Report Viewer or the Web Filter Reports tab.
- Select the Top Categories report (by size or requests). In our example, you can see Games was at the top.
- Click on the Games pie slice, and when prompted to add a condition click Yes.
- All Reports can now be viewed for Games only traffic.
- For example, the Top Clients (by request) will show the clients that visited the most gaming sites.
- For example, the Web Usage (scanned) will show "Gaming" web usage throughout the day of the network.
Related Topics
Custom Reports
Custom Reports allow you to create a report to your specifications and save the report for future use. These can be added by copying an existing report and modifying it to your needs, or by creating a report from scratch. Both methods require a strong understanding of how reports in Arista work and the Database Schema.
If you're having trouble creating any reports give us a shout on the forums or through support. As we receive requests for common reports we will add these as default reports in future releases.
Add Custom Reports
The Copy or Customize features allow you to use an existing report as a base for creating new reports. We recommend using an existing report to base your custom report as the fields and queries are much easier to understand.
Copy Report- Go to the Reports Section,
- Locate the report you want to copy and click Settings.
- Rename the title and click the Create New button. A copy of the report is made with the new title.
- Modify other report settings as needed.
- Click Preview/Refresh to view changes.
- Click Update to save the changes to the report.
- Rename the report and modify other report settings as needed.
- Click Create New to save the report with a new name.
- Go the Reports section.
- Click the Add/Import button and select Create New. A blank report form will appear.
- Name the report and description, select the category and report type of graph and fill other fields to customize the report.
- Click Preview/Refresh at any time to preview the report.
- Click Create New or Update to save the report.
Report Fields
| Report Field | Description |
|---|---|
| Category | The app where the report will be displayed. |
| Title | Title of the report. |
| Description | Description will be shown under the title of the report to provide the reader more information. |
| Enabled | Disabled reports will not be shown in the list within the application. |
| Display Order | Determines the order the reports are displayed within the application. |
| Units | Unit of measure displayed on the graph. |
| Table | Table from the Database Schema to query. |
| Type | Time Chart (Line or Bar), Pie Chart, or Text Chart. |
| Time Chart Style | Line, Bar, or Bar 3D. Bar charts can also be overlapped or separate columns. |
| Time Data Interval | Auto is recommended. You can also use seconds, minutes, hours, day, week or month. |
| Time Data Columns | Data from the table defined above that you wish to use for your chart. This is written with SQL syntax. Add each column or data series on a new line. See the Web Usage (all) report for a good example. |
| Pie Group Column | Column from the table defined above that you wish to group data by. This uses the column name from the Database Schema. |
| Pie Sum Column | Determines how data is calculated after grouping. Common functions would be count() and sum() for specific columns within the table. See the Web Filter Top Sites reports (by size and by request) for good examples. |
| Pie Slices Number | Determines how many results are shown. |
| Text Columns | Data from the table defined above that you wish to use for your page. This is written with SQL syntax. Add each column or data series on a new line. These will be referred to in the text string using the line number. |
| Text String | Text string to be shown on the page. This can include columns from the text columns query. See the Ad Blocker summary report for a good example. |
| Color | Colors used in the chart, defined by hex color codes. |
| Order By Column | Determines how the order will be determined. This will typically be 'value' for pie charts, and left blank for others. |
| Order Direction | Order for the data to be displayed. For a pie chart, this is typically Descending and for time chart, this is typically Ascending. |
| Sql Conditions | Additional conditions added to the data. This can be useful for specifying a username, IP address of other information. |
Custom Report Example - User Reporting
A commonly requested report is to be able to monitor a problem employee or student who is using bandwidth excessively or accessing inappropriate web content. You can add this report so that it is always accessible under the Web Filter report tab very easily.
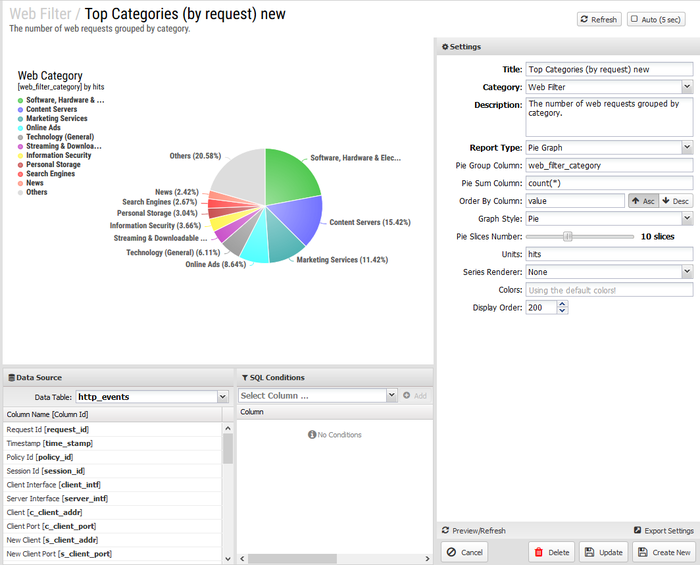
To start, get an idea of the reports you're interested in. For this example we'll use Top Sites (by size), but others like Top Categories or Top Flagged sites might also be useful. This is intended to be a rough outline of the procedure; adjust as needed.
Creating the Report- Go to Reports
- Scroll to the Web Filter and select a report.
- Update the Title for the report and description if necessary.
- Click Create New
- Since you are interested in the same type of data, all other report fields can remain the same.
- In SQL Conditions, add conditions. For this example we will use the username but you might also use hostname, client address of other fields.
- In the Select Column field, select username.
- Click Add.
- Use the = operator and enter the username for the user in the Value field.
- Click Update.

Custom Report Example - Rack Reporting
With Policy Manager, racks can be created to allow different policies to apply to different groups. When reporting, you might wish to see how traffic is being handled differently across racks. Creating custom reports to show information related to a specific rack is easy to accomplish.
For this example we'll use Application Control Top Flagged Applications, but this same procedure would apply for any other application or report. This is intended to be a rough outline of the procedure; adjust as needed.
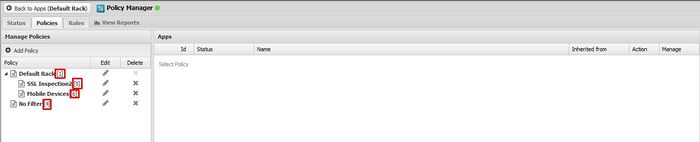
Find the Rack ID- Open Policy Manager Settings.
- Under the Policies tab is a listing of racks with the ID.
- Take note of the rack(s) of interest. For this example we'll use rack id 6 for Mobile Devices.
- Go to Reports.
- Scroll to the Application Control reports and select a report.
- Update the Title for the report and description. Here we have added "Mobile Devices Rack".
- Click Create New
- Since you are interested in the same type of data, all other report fields can remain the same.
- In Sql Conditions, add the condition for the policy_ID.
- Click Add.
- In the Column field, select policy_id.
- Use the = operator and enter the policy id of 6 (matching the Mobile Devices rack) in the Value field.
- Click Done.

Policy Manager
Policy Manager is one of NG Firewall's most powerful features. It works by allowing you to create multiple policies, which are different sets of applications configured differently for different use cases.

About Policy Manager
Often, you will configure all of NG Firewall apps to service the whole network; however, often, it is necessary to handle traffic for some users or network devices differently. For example, you may want Web Filter to be different for students vs teachers, and you may want no Web Filtering at all for your servers. You may want to run Captive Portal only on the WiFi network or for unidentified devices. You may want to block certain applications with Application Control, but only at certain times of days.
- Set up multiple policies for different users, hosts, networks, interfaces, times of day, days of week, etc.
- Choose what applications are running in each policies.
- Configure multiple applications in separate policies simultaneously using the Parent Policy system.
This allows you to "copy" the configuration of some applications from another policy but not others - this makes doing things such as having different Web Filter settings across policies but keeping the configuration of all other applications identical across policies. There is not usually a need to modify settings for applications like Virus Blocker or Spam Blocker between different user groups. However, if it is necessary, it only takes a few clicks.
Note that we will be using the example of a school a lot in this section as it is quite apt in showing how Policy Manager can help you with different user classes. This can be applied to any organization; just look for groups you can fit users into - Administrative Assistants, Marketing, or HR, you're free to choose. It can also apply to different sets of servers (i.e., a DMZ policy for handling public servers, an Internal policy for handling internal user machines, and a Wireless policy for handling wireless users), and it can also apply to different times of day (i.e., a Lunchtime and After Hours policy and a Work Hours policy). For simplicity the examples below will mostly use the school groups.
Getting Started with Policy Manager
Policies provide a way to handle different settings for different sessions. Using our example, an NG Firewall protecting a school might have three policies - Students, Teachers, and Administrators. These policies provide completely separate configurations for traffic processing; for example, you could allow teachers to access Facebook but not students.
NG Firewall will always have at least one policy, the Default Policy. You can rename but you cannot remove this policy. As mentioned before, you create Rules to send traffic to policies where it is processed by the applications. Policies are created from within Policy Manager, however you will use NG Firewall's web GUI to switch to and configure each policy. At the top of the web GUI, you will see Default Policy with an arrow next to it - clicking this arrow allows you to change the policy you're looking at, and access the Sessions Viewer and Hosts Viewer, and open the Policy Manager Settings directly.
Parent Policies
When you first create a new policy, it will not contain any applications. You can add in any applications you want and configure them to your liking, or you can use the Parent Policy system. When creating a new policy using Policy Manager, you have the option to select a Parent Policy. If you use this option your new policy will be pre-populated with all applications and settings from the Parent Policy you selected, however it will look a bit different.
When you view the new child policy, the application faceplates will be greyed out, and you will be unable to click Settings. This is because the settings for these applications are being inherited from the parent policy, which is useful because it saves you from having to reconfigure applications you want operating the same way in multiple policies, such as the virus scanners. To change the settings or view the Event Logs, you'll need to open the application on the parent policy and use the drop-down to select the policy to view traffic.
If you want to modify the settings of an application in a child policy, you'll need to install the application you want to modify in the child policy - I know, it's already there, but you can't click Settings to modify the configuration. On the Apps tab on the left side of the web GUI, just click Install again. After a few seconds, the app will re-appear, and you will be able to click settings. Once this has happened, the new child application overrides the application inherited from the parent. The settings of the parent policy for this application have no effect for the application you have added to the child policy. If you're following along, your child policy will contain all applications that your parent policy does. However, only one will have the Settings button enabled.
To recap, using our school example, we would send students to the Default Policy, then create a new Teacher Policy which uses the Default Policy as its Parent Policy. If you go to the Teacher Policy, all the apps will be greyed out, and you will not be able to modify any settings because they are copied from the Default Policy. By adding in a new copy of Web Filter, you can modify the settings so the teachers can access websites the students cannot; however, settings for all other applications will still be copied from the Default Policy.
Settings
This section reviews the different settings and configuration options available for Policy Manager.
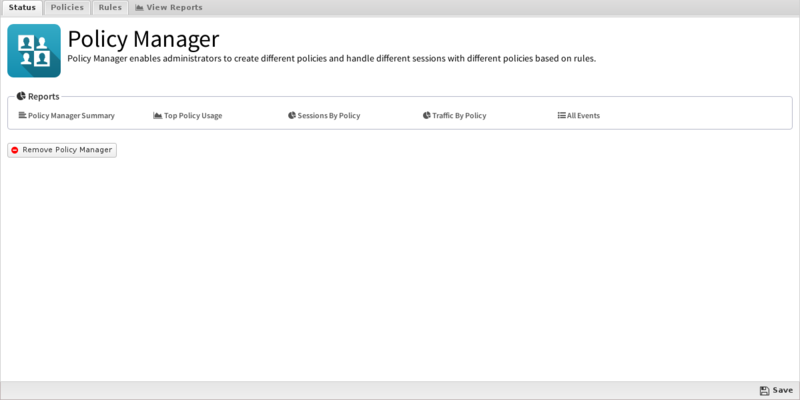
Status
Policies
From this tab you can create new policies; however,note you'll first need to create and save a policy before you can create a rule to apply traffic to that policy.
- Name: The name of this policy is displayed in the web GUI.
- Description: A description of this policy.
- Parent Policy: Which policy (if any) this one should use as a Parent Policies.

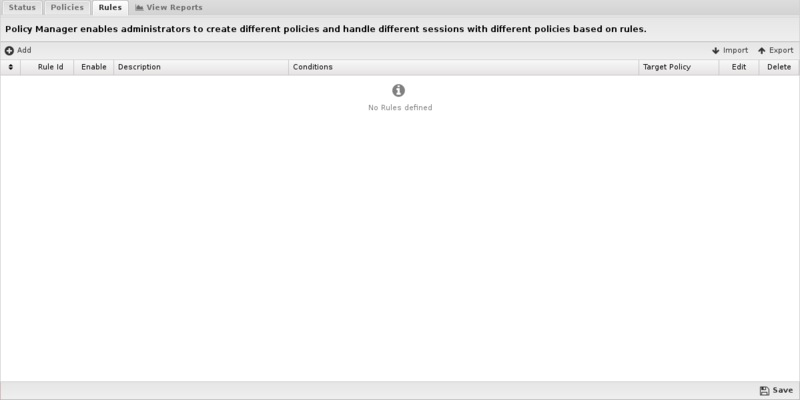
Rules
If you've been reading up until this point, you may have guessed that this new policy will do nothing until you send traffic to it. To accomplish this, you'll need to create a rule - click Add in the Rules tab.
When each new session is processed, the rules are evaluated in order. If all of a sessions attributes match all of the criteria of a rule, it is considered a match. The policy for the first matching rule will be used to process the session. If no rules match, the Default Policy willprocess the session.
These rules operate as described in the Rules documentation.
Like many areas of NG Firewall, the rules work from the top down. Let's go back to our school example and say we have three policies: Default (for students), Teacher, and Administrative Staff. To get traffic to these policies, we would need to create two policies: one for the Teacher policy and one for the Administrative Staff policy - any traffic that did not match those two policies would be sent to the Default Policy. You can also explicitly add a rule sending traffic to the Default Policy, although it's not required.
If the policy rule for the Teacher policy is incorrect, it may end up matching all network traffic and sending it to the Teacher policy. Because it matches, the rule under it (for the Administrative Policy) will never be evaluated. On the flip side, if a rule is too narrow, it may not match the traffic you're trying to match at all, dumping it on the Default Policy. Because of this, we recommend starting out policy rules as very general (e.g., match a few IPs or an entire subnet) and then tightening them down from there - let's look at some common example policies:
File:Policy rules.png Quick look at the rules table
So this is the Rules tab of the Policy Manager settings. On this page you will be able to see all of the rules that will be evaluated when determining which policy to direct a specific user or IP address. Pay attention to the 'Target Policy' column. Any users defined in the corresponding rule will be directed to that policy. Click on the page icon under the 'edit' column to define the rule.
File:Policy rules2.png Click Edit and define the rule.
Reports
The Reports tab provides a view of all reports and events for all traffic handled by Policy Manager.
This applications reports can be accessed via the Reports tab at the top or the Reports tab within the settings. All pre-defined reports will be listed along with any custom reports that have been created.
Reports can be searched and further defined using the time selectors and the Conditions window at the bottom of the page. The data used in the report can be obtained on the Current Data window on the right.
| Report Entry | Description |
|---|---|
| Policy Manager Summary | A summary of Policy Manager actions. |
| Top Policy Usage | The amount of bandwidth per policy. |
| Sessions By Policy | The number of sessions for each policy. |
| Traffic By Policy | The amount of traffic for each policy. |
| All Events | Lists all sessions with the Policy Manager policy that handled the session. |
Policy Manager Reports
The Reports tab provides a view of all reports and events for all traffic handled by Policy Manager.
Reports
This applications reports can be accessed via the Reports tab at the top or the Reports tab within the settings. All pre-defined reports will be listed along with any custom reports that have been created.
Reports can be searched and further defined using the time selectors and the Conditions window at the bottom of the page. The data used in the report can be obtained on the Current Data window on the right.
| Report Entry | Description |
|---|---|
| Policy Manager Summary | A summary of Policy Manager actions. |
| Top Policy Usage | The amount of bandwidth per policy. |
| Sessions By Policy | The number of sessions for each policy. |
| Traffic By Policy | The amount of traffic for each policy. |
| All Events | Lists all sessions with the Policy Manager policy that handled the session. |