NG Firewall Performance Apps
Bandwidth Control
Bandwidth Control gives you the power to monitor and control bandwidth usage on your network.

About Bandwidth Control
Bandwidth control can be used to ensure that your network continues to operate smoothly and that bandwidth is shared optimally based on what is important to you. Many organizations struggle with bandwidth problems, such as students watching online videos or clients using BitTorrent while more important tasks struggle to complete for bandwidth. You can use Bandwidth Control to give high priority to Video Chat or slow down all traffic from machines using BitTorrent.
Settings
This section reviews the different settings and configuration options available for Bandwidth Control.
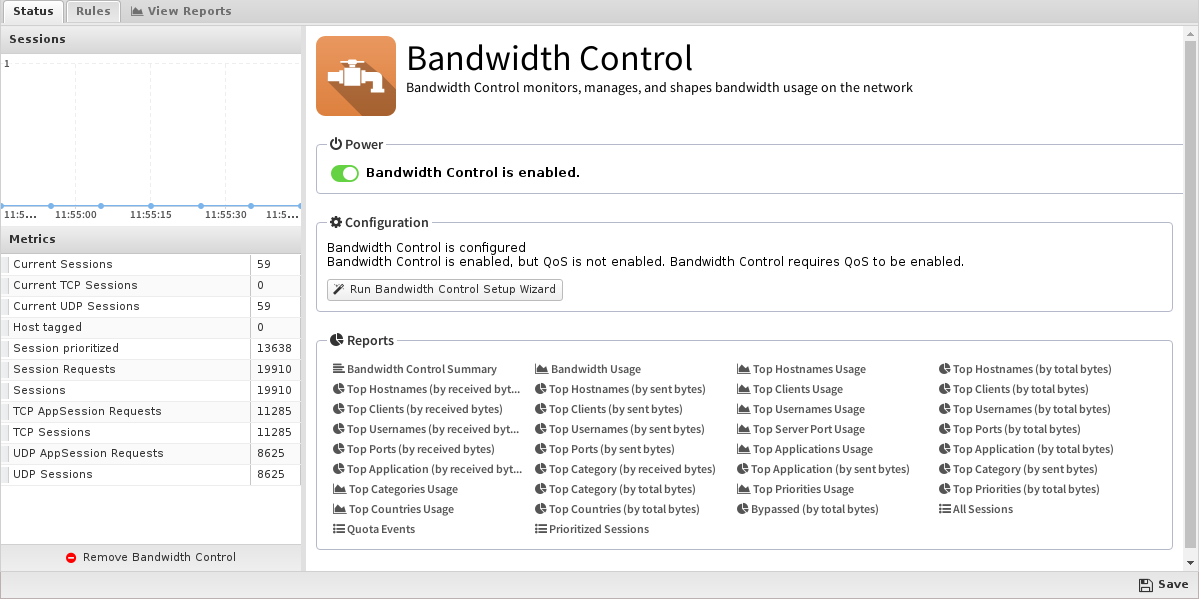
Status
Setup Wizard
- Configure WAN download and upload bandwidth: After the welcome screen, you will be asked to set the bandwidth rates of your WAN interface. This is the most important setting in the configuration of Bandwidth Control. If you are unsure, it is recommended that you run some bandwidth tests when there is no other activity to determine the true download and upload rates of your WAN connection. Entering a value around 95%-100% of the measured value is typically ideal. If the value is too low, Bandwidth Control will unnecessarily limit bandwidth to the value you have entered. If the value is too high, Bandwidth Control will be less effective as it will over-allocate bandwidth and lose some ability to differentiate by priority. You will be asked to repeat this process for each WAN interface.
- Choose a starting configuration: After setting the WAN settings, choose a configuration that best suits your organization. Each configuration's goals are described and what is prioritized and deprioritized. These rules can be customized later - this is just a starting configuration.
- Quotas: In addition to the starting configuration, quotas can also be configured. Most sites will not need quotas. However, quotas can be extremely useful in some scenarios to prevent users from monopolizing resources. To enable quotas, click on Enable and provide information that best suites your organization.
- Quota Clients: The clients will be given quotas. Be careful to not give a range that includes any servers and machines that you don't want to have quotas.
- Quota Expiration: The expiration time of each quota (or length of time the quota will be in use.) After a quota expires, a new quota will be granted.
- Quota Size: The size of the quota each host is granted (in bytes).
- Quota Exceeded Priority: The priority given to hosts after they exceed their quota (if they do so).
After this, your configuration of Bandwidth Control is complete and Bandwidth Control is enabled!
Rules
The Rules documentation describes how rules work and how they are configured.
- Set Priority Sets the matching session to the chosen priority.
- Priority The priority to be assigned.
- Tag Host adds tag to the host to mark it for further actions.
- Give Host a Quota: Gives the host IP a quota.
- Quota Expiration defines how long their quota will last
- "End of Hour" means the quota will expire at the 59th minute of the hour.
- "End of Day" means the quota will expire at 11:59pm of the day.
- "End of Week" means the quota will expire 1 minute before the end of week (Saturday 11:59pm if US-localized)
- An integer can also be specified for the number of seconds the quota will last from the creation date.
- Quota Bytes defines the number of bytes in their quota.
- Quota Expiration defines how long their quota will last
- Give User a Quota: Gives the user a quota
- Quota Expiration defines how long their quota will last
- "End of Hour" means the quota will expire at the 59th minute of the hour.
- "End of Day" means the quota will expire at 11:59pm of the day.
- "End of Week" means the quota will expire 1 minute before the end of week (Saturday 11:59pm if US-localized)
- An integer can also be specified for the number of seconds the quota will last from the creation date.
- Quota Bytes define the number of bytes in their quota.
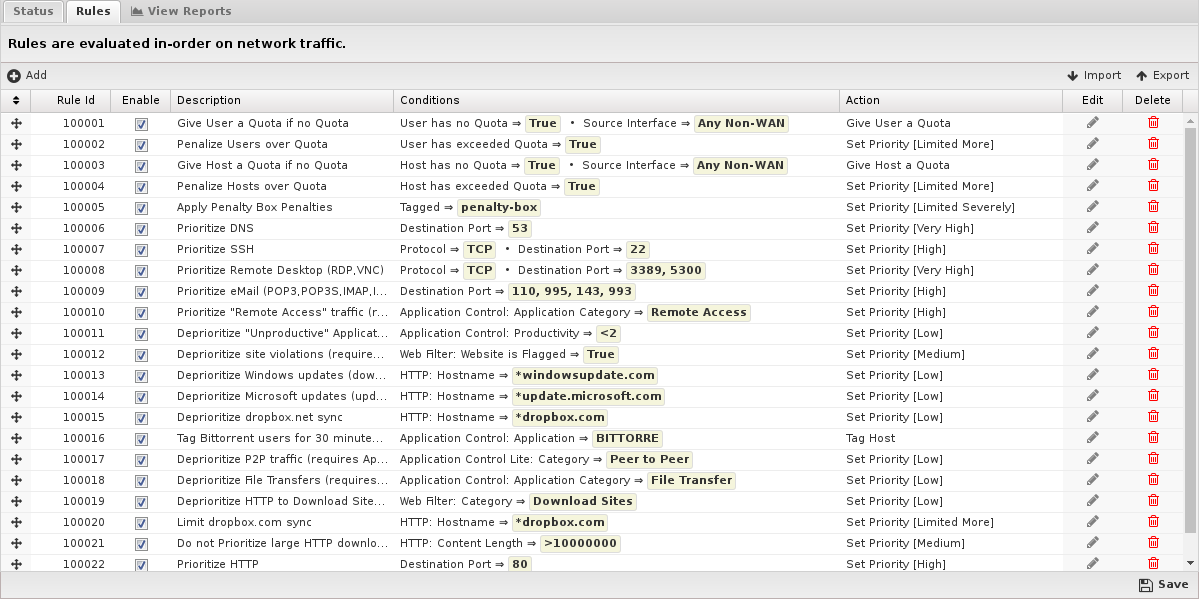
- Quota Expiration defines how long their quota will last
Priorities
The overall effect of Bandwidth Control is to map traffic to priorities which are enforced by the QoS engine. There are 7 Priorities: Very High, High, Medium, Low, Limited, Limited More, and Limited Severely.
The first four priorities can be thought of as "normal" - very High, High, Medium, and Low. They are given certain precedence over bandwidth rights. Very High traffic can consume bandwidth before High, Medium, and Low. The Very High bucket will be assigned the largest amount of bandwidth, less to High, even less to Medium, and much less to Low.
The other three - Limited, Limited More, and Limited Severely - are different in that they will never use all available bandwidth. The classes are punitive because they will limit bandwidth to a percentage of the whole, even if more is available.
To read much more in depth about the effects of prioritization and how bandwidth allotment works, see QoS.
A fundamental principle is that limiting traffic to a fixed low rate enforcement is almost never the right thing to do because wasted bandwidth is irrecoverable. In cases where the desire is to starve less important traffic, it should be assigned a lesser priority (medium or low) to still consume all bandwidth if no more important tasks are available. This means the less important task will finish quicker so that later, these resources are free, which occurs definitionally at no expense to higher priority traffic.
The priorities that limit to less than 100% even when the bandwidth is unused (Limited, Limited More, and Limited Severely by default) are useful for punitive situations.
Quotas
Quotas are set amounts of data that can be used over a certain amount of time. This is useful for sites where you want to punish excessive usage. For example, in a hotel we want each IP to get 1 GB a day, but if this amount is exceeded it will be considered excessive and that host can be treated differently (be blocked, receive less bandwidth, etc). By using quotas and rules, bandwidth abusers are handled automatically requiring no administrator intervention.
Quotas can be assigned to Users or Hosts, and the current quota status can be viewed by clicking on Users or Hosts accordingly. All sessions' data passing through NG Firewall gets counted against the corresponding Host or User.
Reports
The Reports tab provides a view of all reports and events for all traffic handled by Bandwidth Control.
Reports
This application's reports can be accessed via the Reports tab at the top or the Reports tab within the settings. All pre-defined reports will be listed along with any custom reports that have been created.Reports can be searched and further defined using the time selectors and the Conditions window at the bottom of the page. The data used in the report can be obtained on the Current Data window on the right.
Pre-defined report queries:
| Report Entry | Description |
|---|---|
| Bandwidth Control Summary | A summary of Bandwidth Control actions. |
| Bandwidth Usage | The approximate averaged data transfer rate (total, sent, received) over time. |
| Top Hostnames Usage | The bandwidth usage of the top hostnames. |
| Top Hostnames (by total bytes) | The sum of the data transferred grouped by hostname. |
| Top Hostnames (by received bytes) | The sum of the received data grouped by hostname. |
| Top Hostnames (by sent bytes) | The sum of the sent data grouped by hostname. |
| Top Clients Usage | The bandwidth usage of the top clients. |
| Top Clients (by total bytes) | The sum of the data transferred grouped by client address. |
| Top Usernames Usage | The bandwidth usage of the top usernames. |
| Top Usernames (by total bytes) | The sum of the data transferred grouped by username. |
| Top Server Port Usage | The bandwidth usage by top server port. |
| Top Ports (by total bytes) | The sum of the data transferred grouped by server port. |
| Top Ports (by received bytes) | The sum of the data received grouped by server port. |
| Top Ports (by sent bytes) | The sum of the data sent grouped by server port. |
| Top Applications Usage | The bandwidth usage of the top applications. |
| Top Application (by total bytes) | The sum of the data transferred grouped by Application Control application. |
| Top Application (by received bytes) | The sum of the data sent grouped by Application Control application. |
| Top Application (by sent bytes) | The sum of the data sent grouped by Application Control application. |
| Top Categories Usage | The bandwidth usage of the top application categories. |
| Top Category (by total bytes) | The sum of the data transferred grouped by Application Control category. |
| Top Priorities Usage | The bandwidth usage by priority. |
| Top Priorities (by total bytes) | The sum of the data transferred grouped by priority. |
| Top Countries Usage | The bandwidth usage by top countries. |
| Top Countries (by total bytes) | The sum of the data transferred grouped by country. |
| Bypassed (by total bytes) | The sum of the data transferred grouped by bypassed. |
| All Sessions | All sessions are processed by Bandwidth Control. |
| Quota Events | Shows when quotas are assigned or expired. |
| Prioritized Sessions | All sessions are prioritized by Bandwidth Control. |
Bandwidth Control Reports
The Reports tab provides a view of all reports and events for all traffic handled by Bandwidth Control.
Reports
This application's reports can be accessed via the Reports tab at the top or the Reports tab within the settings. All pre-defined reports will be listed along with any custom reports that have been created. Reports can be searched and further defined using the time selectors and the Conditions window at the bottom of the page. The data used in the report can be obtained on the Current Data window on the right. Pre-defined report queries:
| Report Entry | Description |
|---|---|
| Bandwidth Control Summary | A summary of Bandwidth Control actions. |
| Bandwidth Usage | The approximate averaged data transfer rate (total, sent, received) over time. |
| Top Hostnames Usage | The bandwidth usage of the top hostnames. |
| Top Hostnames (by total bytes) | The sum of the data transferred grouped by hostname. |
| Top Hostnames (by received bytes) | The sum of the received data grouped by hostname. |
| Top Hostnames (by sent bytes) | The sum of the sent data grouped by hostname. |
| Top Clients Usage | The bandwidth usage of the top clients. |
| Top Clients (by total bytes) | The sum of the data transferred grouped by client address. |
| Top Usernames Usage | The bandwidth usage of the top usernames. |
| Top Usernames (by total bytes) | The sum of the data transferred grouped by username. |
| Top Server Port Usage | The bandwidth usage by top server port. |
| Top Ports (by total bytes) | The sum of the data transferred grouped by server port. |
| Top Ports (by received bytes) | The sum of the data received grouped by server port. |
| Top Ports (by sent bytes) | The sum of the data sent grouped by server port. |
| Top Applications Usage | The bandwidth usage of the top applications. |
| Top Application (by total bytes) | The sum of the data transferred grouped by Application Control application. |
| Top Application (by received bytes) | The sum of the data sent grouped by Application Control application. |
| Top Application (by sent bytes) | The sum of the data sent grouped by Application Control application. |
| Top Categories Usage | The bandwidth usage of the top application categories. |
| Top Category (by total bytes) | The sum of the data transferred grouped by Application Control category. |
| Top Priorities Usage | The bandwidth usage by priority. |
| Top Priorities (by total bytes) | The sum of the data transferred grouped by priority. |
| Top Countries Usage | The bandwidth usage by top countries. |
| Top Countries (by total bytes) | The sum of the data transferred grouped by country. |
| Bypassed (by total bytes) | The sum of the data transferred grouped by bypassed. |
| All Sessions | All sessions are processed by Bandwidth Control. |
| Quota Events | Shows when quotas are assigned or expired. |
| Prioritized Sessions | All sessions are prioritized by Bandwidth Control. |
Related Topics
Branding Manager
Branding Manager is designed to allow you to rebrand user-facing components by adding your company logo, name, URL, and contact email.

Branding Manager will replace the "Arista Edge Threat Management" branding in all user-facing interactions, such as block pages, quarantine digest emails, quarantine digests, root certificate installer, etc. This is not meant to remove all Arista Edge Threat Management branding; the administrator UI still contains many references to NG Firewall. For HTML/CSS experts, combining Branding Manager with a custom block page skin and a custom rack skin gets you a fully customized style. Of course, you don't need a custom skin to change any of the branding elements - see the table below to see what you can change with Branding Manager!
Settings
Status
This displays the current status and some statistics.
Settings
This section reviews the different settings and configuration options available for Branding Manager.

- Logo: Use this option to upload a replacement logo.
- Contact Information
- Company Name: The name of your company.
- Company URL: The URL for your website (for example, http://www.arista.com).
- Contact Name: The name of the network administrator who should be contacted if questions or problems arise.
- Contact Email: The email address of the network administrator (for example, This email address is being protected from spambots. You need JavaScript enabled to view it.)
- Banner Message
- Message Text: Text that will be displayed above login boxes. This is restricted to plain text.
Fine-tune Your Logo
- Convert your image to Greyscale: Using Adobe Photoshop, open your image and go to , specify GIF and Greyscale, then save.
- Resize your image: Using Adobe Photoshop, open your image and go to , click the Image tab, and resize to 150x100.
- Place your logo on a background: Download the templates, then overlay your logo.
WAN Balancer
WAN Balancer works in conjunction with multiple ISPs to distribute your traffic across multiple connections. It will decide dynamically which WAN connection to send traffic over, maximizing your bandwidth usage.

You may also consider using WAN Failover in your network as well - it automatically reroutes traffic over working WAN links when one fails. If WAN Failover is running and detects a WAN as being down, WAN Balancer will not balance traffic to that WAN.
Settings
This section reviews the different settings and configuration options available for WAN Balancer.
Status

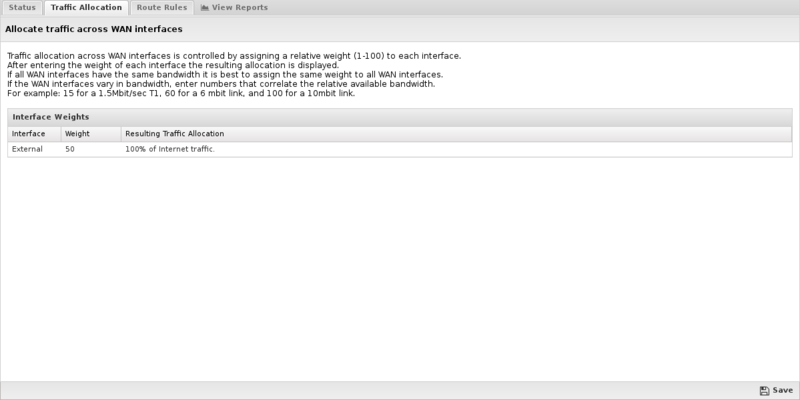
Traffic Allocation
On the Traffic Allocation tab, you set the weights for each WAN connection. If you only have one WAN defined, you will only see one interface listed here. Simply enter the weighting you desire, check that you are good with the percentages assigned to each WAN, and hit save.
As each WAN Balancer processes each new session, it decides which WAN it will use to send this traffic if there is no local route for the traffic. If traffic between these two IPs has taken place recently, then there is likely a route already in the cache. If so, this route will be used to send this new session. This is to ensure that all traffic between two IPs uses the same WAN consistently to avoid issues with cloud services.
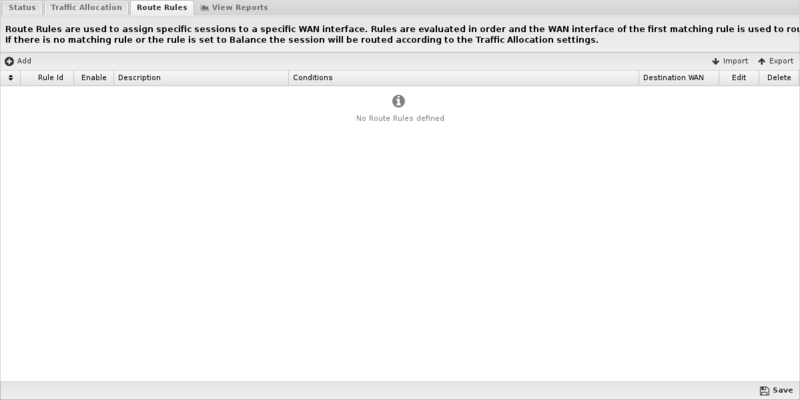
Route Rules
Route Rules determine which WAN will be used for traffic going to the internet (traffic with no local route). As described in the Rules documentation, the Route Rules are evaluated for new sessions, and the first matching rule will determine which WAN interface is used. If no matching rule is found or the first one has a Destination WAN set to Balance, then the session will be randomly assigned a route based on Traffic Allocation settings. A limited set of conditions are available to WAN Balancer Route Rules, which include source, destination, port and protocol.
- To put all one server's traffic on a specific WAN, add a rule with the condition "Source Address is server_ip", and the Destination WAN is the WAN to be used.
- To put all SMTP to go out a specific WAN, add a rule with "Destination Port is 25," and the Destination WAN is the WAN to be used.
This is also useful if you have one connection with less throughput but lower latency. In this case, you can specify that all VOIP or latency sensitive traffic use the lower latency connection.
Reports
The Reports tab provides a view of all reports and events for all traffic handled by WAN Balancer.
This application's reports can be accessed via the Reports tab at the top or the Reports tab within the settings. All pre-defined reports will be listed along with any custom reports that have been created.
Reports can be searched and further defined using the time selectors and the Conditions window at the bottom of the page. The data used in the report can be obtained on the Current Data window on the right.
Pre-defined report queries:
| Report Entry | Description |
|---|---|
| WAN Balancer Summary | A summary of WAN Balancer actions. |
| Sessions By Interface | The number of sessions destined for each interface. |
| Bytes By Interface | The number of bytes destined to each interface. |
The tables queried to render these reports:
Related TopicsWAN Balancer Reports
The Reports tab provides a view of all reports and events for all traffic handled by WAN Balancer.
Reports
This application's reports can be accessed via the Reports tab at the top or the Reports tab within the settings. All pre-defined reports will be listed along with any custom reports that have been created.
Reports can be searched and further defined using the time selectors and the Conditions window at the bottom of the page. The data used in the report can be obtained on the Current Data window on the right.
| Report Entry | Description |
|---|---|
| WAN Balancer Summary | A summary of WAN Balancer actions. |
| Sessions By Interface | The number of sessions destined to each interface. |
| Bytes By Interface | The number of bytes destined to each interface. |
Related Topics
WAN Failover
WAN Failover works in conjunction with multiple ISPs to assure that you maintain Internet connectivity if a loss of connectivity occurs on one of your WAN connections. If one of your ISP links goes down, WAN Failover will automatically route all traffic over the other WAN(s) until service is restored.

You may also consider using WAN Balancer in your network as well - it allows you to maintain an automatic distribution of traffic over multiple WAN links rather than just failing over if one goes down.
Tests are configured for each WAN which are run continuously to determine the current status of each interface. If enough test fail on a given WAN to exceed the failure threshold then the WAN is considered down and internet-bound traffic will not go out that WAN. The lowest ID active WAN is used as the current default WAN interface for internet-bound traffic.
Settings
This section reviews the different settings and configuration options available for WAN Failover.
Status
- Interface ID: The number of the interface.
- Interface Name: The name of the interface in the NG Firewall GUI.
- System Name: The name of the interface as seen by NG Firewall.
- Online Status: True or False whether the WAN is online.
- Current Tests Count: The total number of the tests ran on that interface.
- Tests Passed: The total number of the tests ran on that interface that passed.
- Tests Failed: The total number of the tests ran on that interface that failed.

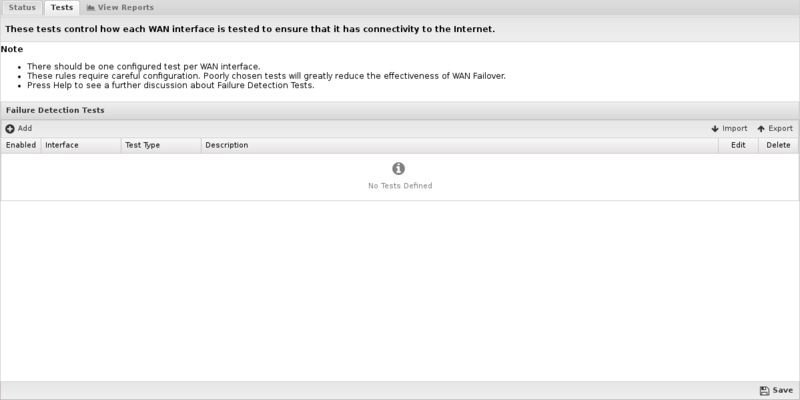
Tests
WAN Failover must have tests set up for every WAN interface; these tests are set up on the Tests tab. Just click Add, select your interface and test type, then run the test - if it passes, go ahead and save it.
Tests are how WAN Failover determines if the given WAN interface is up or down so it is important to pick tests carefully that correlate with the status of that WAN connection. For example, pinging an ISP router is generally a good test because it will usually fail when the ISP is down but works when connectivity is good. Pinging a public site like google.com may work but may sometimes have false positives or false negatives. Pinging the gateway may also work but may sometimes provide false positives when the gateway is reachable but the ISP is offline.
- Interface: The interface you want to set up a test for.
- Description: A description for this test.
- Testing Interval: Determines how often (in seconds) your specified test will be executed.
- Timeout: The maximum time that may pass without receiving a response to your test. This value should be less than the Testing Interval. You should make sure that you allow for enough time to pass if you have a poor connection to the internet, or a connection that often has long latency (delays) associated with it.
- Failure Threshold: How many failures are acceptable during the testing period.
- Test Type: is the specific method you will use to determine whether failover will be initiated.
Note on DNS tests:
Reports
The Reports tab provides a view of all reports and events for all traffic handled by WAN Failover.
This application's reports can be accessed via the Reports tab at the top or the Reports tab within the settings. All pre-defined reports will be listed along with any custom reports that have been created.
Reports can be searched and further defined using the time selectors and the Conditions window at the bottom of the page. The data used in the report can be obtained on the Current Data window on the right.
Pre-defined report queries:
| Report Entry | Description |
|---|---|
| WAN Failover Summary | A summary of WAN Failover actions. |
| WAN Disconnect Events | The number of disconnect events grouped by WAN. |
| WAN Interface Outages | The failed tests of each interface over time. |
| Outage Events | Events where the failure threshold was exceeded, and the WAN was considered offline. |
| Test Events | All test events and their outcome. |
| Failed Test Events | All tests that resulted in failure. |
| Success Test Events | All tests that resulted in success. |
WAN Failover Reports
The Reports tab provides a view of all reports and events for all traffic handled by WAN Failover.
Reports
This application's reports can be accessed via the Reports tab at the top or the Reports tab within the settings. All pre-defined reports will be listed along with any custom reports that have been created.
Reports can be searched and further defined using the time selectors and the Conditions window at the bottom of the page. The data used in the report can be obtained on the Current Data window on the right.
Pre-defined report queries:
| Report Entry | Description |
|---|---|
| WAN Failover Summary | A summary of WAN Failover actions. |
| WAN Disconnect Events | The number of disconnect events grouped by WAN. |
| WAN Interface Outages | The fails tests of each interface over time. |
| Outage Events | Events where the failure threshold was exceeded, and the WAN was considered offline. |
| Test Events | All test events and their outcome. |
| Failed Test Events | All tests that failed. |
| Success Test Events | All tests that resulted in success. |
Related Topics
Web Cache
Web Cache application provides HTTP content caching: as web traffic passes through the NG Firewall server it will be transparently cached. This will both save bandwidth by serving repeat content from the local cache and improve user experience by loading cached sites faster.

Just like Web Filter and other application's on NG Firewall, Web Cache works transparently on traffic passing through the NG Firewall server. There is no need to change any of the settings on any of the PCs behind NG Firewall to gain the benefits of web caching.
As content is downloaded from the web it is stored in a local cache on the disk. Upon later requests of the same web document the content is served directly from the local cache. The same document does not get downloaded multiple times, and the client gets a better user experience because they don't have to wait for subsequent downloads of the same document.
Cache Bypass

Reports
The Reports tab provides a view of all reports and events for all traffic handled by Web Cache.
This application's reports can be accessed via the Reports tab at the top or the Reports tab within the settings. All pre-defined reports will be listed along with any custom reports that have been created.
Reports can be searched and further defined using the time selectors and the Conditions window at the bottom of the page. The data used in the report can be obtained on the Current Data window on the right.
Pre-defined report queries:
| Report Entry | Description |
|---|---|
| Web Cache Summary | A summary of Web Cache actions. |
| Cache Hit-Miss Statistics | The number of cache hits, misses, and sessions bypassed over time. |
| Cache Size Statistics | The amount of cached and uncached web data over time. |
| Web Cache Events | All HTTP events are processed by Web Cache. |
- Web cache stats in the Database Schema
Related Topics
Settings
This section reviews the different settings and configuration options available for Web Cache.
Status
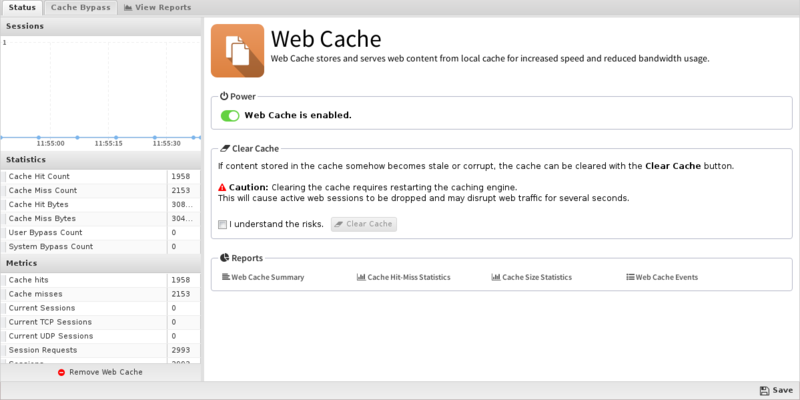
- Statistics: The following information will help you understand the statistics Web Cache provides:
-
- Cache Hit Count displays the total number of HTTP requests that have been served from the cache.
- Cache Miss Count displays the total number of HTTP requests that were not found in cache and thus were served using content retrieved from the external server where the content resides.
- Cache Hit Bytes displays the size, in bytes, of all HTTP requests that have been served from the cache.
- Cache Miss Bytes displays the size, in bytes, of all HTTP requests not found in the cache.
- User Bypass Count displays the number of HTTP sessions that bypassed the cache because the server hosting the content was listed in the user managed cache bypass list.
- System Bypass Count displays the number of HTTP sessions that bypassed the cache because the system determined they were not compatible with our caching model. Web Cache can generally handle all GET and HEAD requests, and we also allow smaller POST requests to transit through the cache logic. Everything else (ie: Large POST requests, non HTTP traffic, etc.) will bypass the cache entirely.
-
- Clear Cache: If content stored in the cache somehow becomes stale or corrupt, the cache can be cleared with the Clear Cache button. As noted in the GUI, clearing the cache requires restarting the caching engine, which will cause active web sessions to be dropped and may disrupt web traffic for several seconds.
Web Cache Reports
The Reports tab provides a view of all reports and events for all traffic handled by Web Cache.
Reports
This application's reports can be accessed via the Reports tab at the top or the Reports tab within the settings. All pre-defined reports will be listed along with any custom reports that have been created.
Reports can be searched and further defined using the time selectors and the Conditions window at the bottom of the page. The data used in the report can be obtained on the Current Data window on the right.
Pre-defined report queries:
| Report Entry | Description |
|---|---|
| Web Cache Summary | A summary of Web Cache actions. |
| Cache Hit-Miss Statistics | The number of cache hits, misses, and sessions bypassed over time. |
| Cache Size Statistics | The amount of cached and uncached web data over time. |
| Web Cache Events | All HTTP events are processed by Web Cache. |