The configuration guide is no longer being updated. Please refer to the CloudVision Help Center going forward.
Managing Tags
On the CloudVision portal, navigate to Provisioning > Tags to view the Tags
Management screen. See the figure below.Figure 1. Tags Management Screen
This screen provides the following functionalities:
Search device or tags field under the Devices column - Type
either the required device name, tags category, or tag name for a quick
search of devices and tags.
Search device, interface, or tags field under the Interface
column - Type either the required device name, tags category, tag name, or
interface name for a quick search of device, interface, or tags.
Select All checkbox - Select the checkbox to choose all devices
simultaneously.
Perform the following steps to create and assign a tag to a device:
On CVP, click Provisioning > Tags.
The system displays the tags screen.
On the Device pane, select device(s) to which you want to create and
assign a tag.
The system opens the Assigned tags pane. See the figure below.Figure 2. Create and Assign
Note:
Optionally, use the search bar for searching required
devices.
To manage interface tags, click the Interface tab and
perform required tasks.
Type the new tag in the search field under User Tags > Add or create
tags > Type the label then the value separated by a colon.
Note:
Tags should be of the form <label>: <value>. For
example, owner: Bill.
The System Tags pane displays tags that are automatically
created and assigned by the system.
Click Create and Assign.
Note: If you had selected multiple devices, the new tag will be simultaneously
assigned to all selected devices.
The new tag is displayed under Manage assigned tags.
Deleting Assigned Tags
Perform the following steps to delete an assigned tag:
On CVP, click Provisioning > Tags.
The system displays the tags screen.
On the Device pane, select the device(s) which is associated with the
tag that needs to be removed.
The system displays all tags assiged to the selected device(s) under
Manage assigned tags. Figure 3. Associated with Selected Devices
Note:
Optionally, use the search bar for searching required devices or
tags.
Hovering the cursor on the number next to the tag name, lists the devices to which the
current tag is assigned.
Click the tag that needs to be removed.
The system displays plus and minus signs when the tag is
clicked.
Click the minus sign to delete the selected tag.
Click Save Edits.
Adding Tags to Multiple Devices
Perform the following steps to add a
tag to multiple devices simultaneously:
On the main pane of the tags screen, select the device to which the tag has
already been assigned to; and new devices to which the tag needs to be assigned.
Under Manage Assigned Tags on the right pane, CVP lists tags that
are assigned to selected devices.
Note: Hovering the cursor on the number next to
the tag name, lists the devices to which the current tag is assigned. See
the figure below.Figure 4. Tag Assigned to Multiple Devices
Click the desired tag.
The system pops up plus and minus signs beneath the tag.
Click the plus sign to add this tag to all selected devices.
Click Save Edits.
Removing Tags from Multiple Devices
Perform the following steps to
remove a tag from multiple device simultaneously:
On the main pane of the tags screen, select devices that are assigned with the
tag that needs to be removed.
Note: Alternatively, search the tag that needs to be removed. CVP lists all
devices to which the tag is assigned to. To remove the tag from few devices,
select only devices from which the tag needs to be removed. If you select
all devices, the tag will be removed from all devices.
Under Manage Assigned Tags on the right pane, the system lists
tags that are assigned to selected devices.
Click the tag that needs to be removed.
The system pops up plus and minus signs beneath the tag. See the figure
below.Figure 5. Remove Tag from Multiple Devices
Click the minus sign to remove the tag from all selected devices.
Click Save edits.
Deleting Unassigned Tags
Perform the following steps to manage unassigned tags:
On CVP, click Provisioning > Tags.
The system displays the tags screen.
On the main pane of the tags screen, click Edit tags.
The system lists all unassigned tags.
Click the tag that needs to be removed.
The clicked tag turns to red.Figure 6. Delete Unassigned Tags
The configuration guide is no longer being updated. Please refer to the CloudVision Help Center going forward.
Dashboards
The Dashboards application allows you to create customizable dashboards consisting of
multiple metrics across various datasets in different views. You can quickly resize and
drag widgets on the grid to accommodate various custom layouts views. Data gathered from
devices configured for streaming telemetry data to CVP.
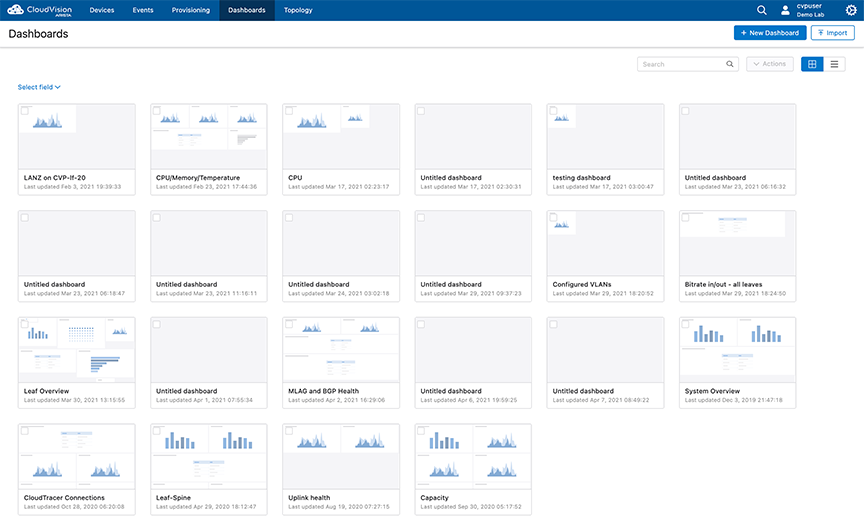
Dashboards Manager is where you are presented with the list of available dashboards. This
screen can be viewed in either a grid or table format.
Figure 1. Dashboard Manager
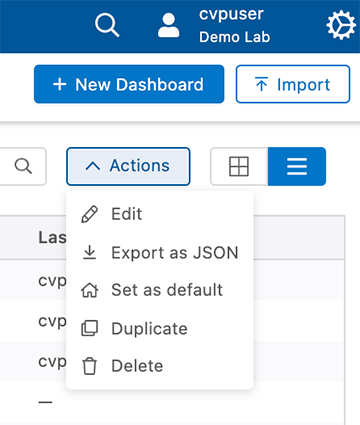
Each dashboard on the grid provides the dashboard name, description, and an approximate
layout of the dashboard. To perform actions on any of the dashboards, select one or more
dashboards by selecting the checkbox associated with each dashboard.
Figure 2. Dashboard Actions Menu
Editing and Creating Dashboards
Creating a Dashboard
Perform the following steps to create a dashboard.
Select New Dashboard from the Dashboard Manager page.
Select one or more widgets to display information. Figure 3. Dashboard Widgets
Select the widget in the main screen to configure and label the widget.
Enter a title and description of the new dashboard.
Select Save Changes to save the new dashboard.
Editing a Dashboard
Perform the following steps to edit a dashboard. Dashboard widgets can be added,
removed, or configured while in editing mode.
Select a dashboard to display from the Dashboard Manager page.
Select Edit Dashboard from the Dashboard Manager page.Figure 4. Editing a Dashboard
Select a currently displayed widget in the main screen to edit or configure as
needed.
To add a new widget, select from widgets tab.
To change the inputs, select the Inputs tab to configure as needed.
Select the pencil icons to edit the dashboard title and description.
Select Save Changes to save the changes.
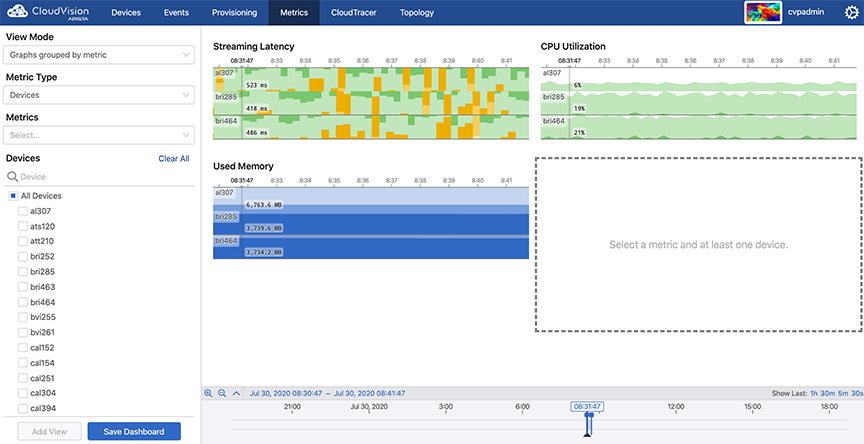
Editing Views
Perform the
following steps to edit a view:
On the CloudVision portal, click the
Metrics tab.
The system displays the
Metrics screen with the list of current dashboards on the
left pane.
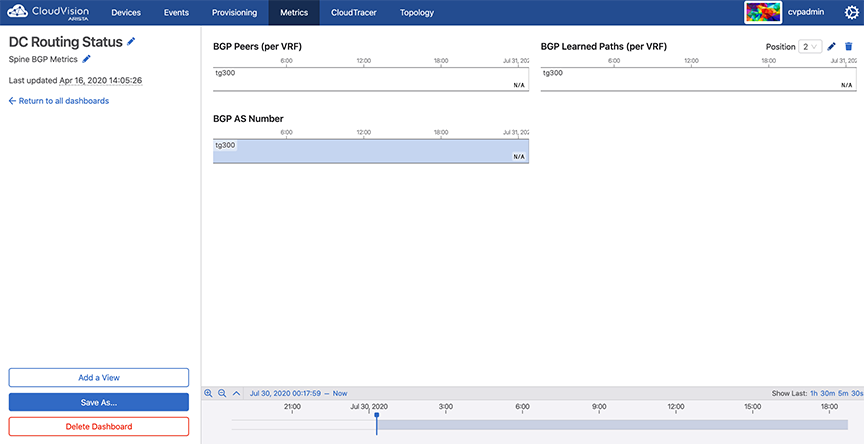
On the left pane of
Dashboards screen, click the required dashboard.
The system displays the
Dashboard details screen.
On the right pane, hover the cursor on the required view pane.
The system displays editable options at the right end of the pane.
Figure 5. View Edit Options
Note: To delete a view, click the appropriate trash icon and then
click
OK on the confirm dialog box.
Select the desired sequence from the
Position drop-down menu.
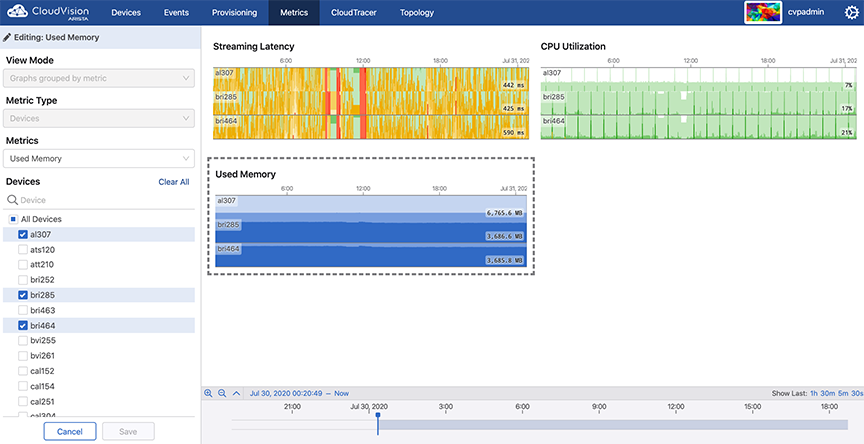
Click the
Edit icon.
The system displays editing options in the left pane. Figure 6. Metrics Editing Options
Provide desired changes in the
Editing View pane.
Click
Save.
Note: If you are editing a view while creating a dashboard, click
Done at the lower end of the left pane.
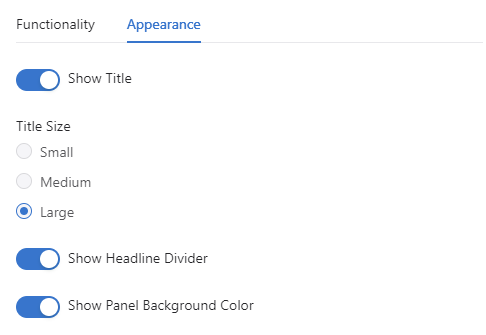
Dashboard Panel Appearance Settings
Every panel has four configurable appearance settings. The available settings include:
Show Title: Select whether to display the title or not.
Title Size: Select a size for the title of the panel.
Show Headline Divider: Hide the separator between the panel title and the
panel contents.
Show Panel Background Color: Enable or disable the panel background
color.
Click the ellipse to the right of the dashboard title.
Figure 7. Accessing Edit Dashboard Appearance
Click Configure in the dashboard configuration menu.Figure 8. Dashboard Configuration Menu
Select the appearance settings for your dashboard.Figure 9. Dashboard Appearance Menu
Syslog Panel
The Syslog panel is a dashboard element that allows to you view log messages for the
devices both in real-time or a selected timeframe.
Creating a Syslog Panel
Create a new dashboard or edit an existing dashboard.
On the sidebar, select the Summaries category and select the Syslog
panel .
Configuring a Syslog Panel
Follow this procedure to Filter log messages by tags (Optional).A single tag filter
input is associated with one tag. This can be a single device, or it could include
many devices that grouped within a single tag.
On the sidebar, select Input category, and select Single Tag
Filter.
Click on the ellipsis of the input and select Configure.
On the Settings Drawer, define a name for the input (Optional).
Select device input type.
Choose the tag label.
Close the settings drawer.
Click on the input to select its specific value. Select a tag value from the
dropdown.
Click on the ellipsis of the Syslog panel and select Configure.
On the Settings Drawer, click on the Dashboard Inputs field to select
the name of the single tag filter.
Close the settings drawer.
Log messages in the syslog panel will be now filtered by the specified
tag.
Dashboards with Custom Query Language widget
The AQL panel is a dashboard element that allows you to create custom data displays using
the CloudVision Advanced Query Language (AQL). This gives you complete control over what
data the panel displays and how it displays it. You define the inputs and write the AQL
query that feeds data to the panel. Further customization is available through creating
a color mapping for the panel’s display, defining units, and decimal places among other
options. You can create custom dashboards with AQL panels that are acutely relevant to
your organization.
There are three elements:
Inputs: These are used by the AQL query to feed data to the AQL panel AQL
Panel: This is the display item within your dashboard and which uses the AQL
query and any inputs to render a display AQL
Panel Visualization: The AQL panel has five ways to display the data fed to it
(Table, Single Value, Bar Graph, Line Graph, and Donut), which each requires
that the AQL query be formatted in a particular way. Each visualization can be
further customized to change how it displays its data
The AQL panel is currently in beta and needs to be enabled as a setting. To enable the
AQL panel, go to General Settings and turn on the toggle Beta Widgets
under Features.
The Arista Support page titled Dashboards with Custom Query Language widget
provides detailed configuration instructions and a tutorial about CloudVision Advanced
Query Language (AQL).
Dashboard Preview
You can preview dashboards from the main dashboards screen. A windowed version of the
selected dashboard can be viewed.
Preview any dashboard by accessing Dashboards and hover over the preview symbol to see a
preview of a dashboard. In the preview, you can hover over relevant information to
obtain details. Select any part of the preview to close the preview and load that
dashboard.
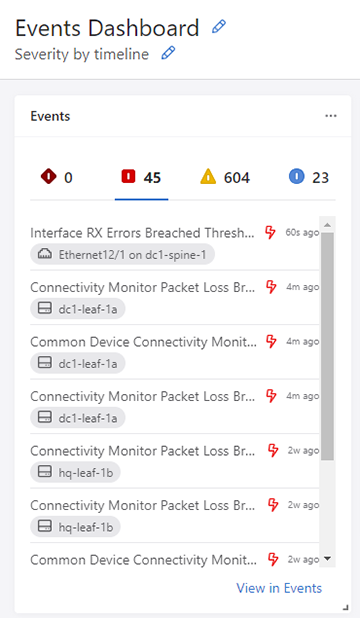
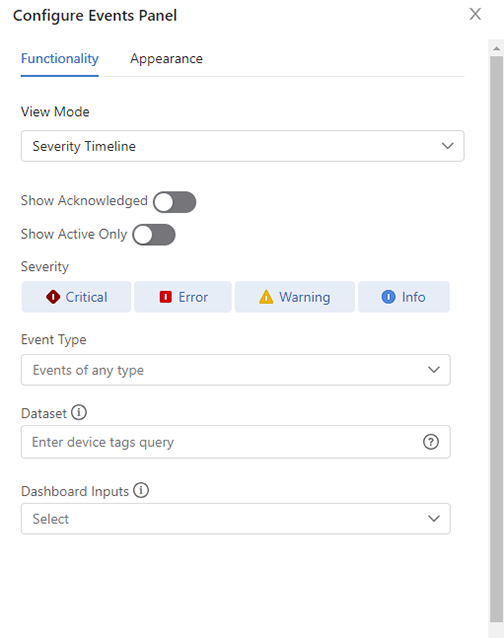
Dashboard Panels
You can customize your dashboard with selectable panels as required.Each dashboard can
be organized with different panels to provice the required information.
As with all other other modes, you can filter this mode,by excluding event severities,
limiting the dataset, showing only acknowledged or active events, and linking to a
dashboard input.
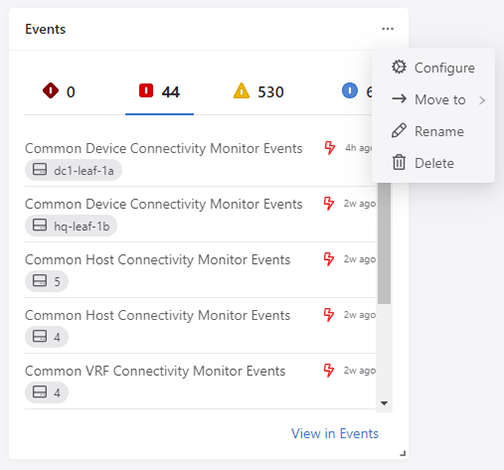
Figure 10. Events Panel
Select the ellipsis (three dots) at the top of the panel to open the Events panel
configuration.
CPU Utilization Events
You will now be alerted when CPU utilization on data plane cores breaches the
threshold.
Average Data Plane CPU Utilization Breached Threshold
This event pushes a notification when average CPU utilization across all data plane
cores has exceeded the default 80% threshold.You may set an alternative threshold
by configuring an event rule.
Data Plane CPU Utilization Breached Threshold
This event pushes a notification when CPU utilization for a single data plane core
has exceeded the 80% default threshold. You may set an alternative threshold by
configuring an event rule.
Confidence Check Events
You will now be alerted when CloudVision detects errors or potential errors in EVPN
and VXLAN configurations.
EVPN Config Confidence Check Failed
This event raises an alert if there are any errors or potential errors with EVPN
configuration. You are notified of the specific verification check that caused the
confidence check failure. The EVPN config confidence check includes the following
verification checks: general EVPN verification, layer 2 EVPN verification, and VXLAN
encapsulation EVPN verification. All verification checks must pass to avoid an EVPN
config confidence check failure.
VXLAN Config Confidence Check Failed
This event raises an alert if there are any errors or potential errors with VXLAN
configuration. You are notified of the specific configuration check that caused the
confidence check failure. The VXLAN config confidence check includes the following
configuration checks: local VTEP configuration, remote VTEP configuration, platform
configuration, CloudVision Exchange configuration, and MLAG configuration. All
configuration checks must pass to avoid a VXLAN config confidence check failure.
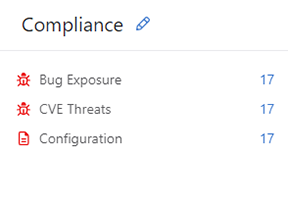
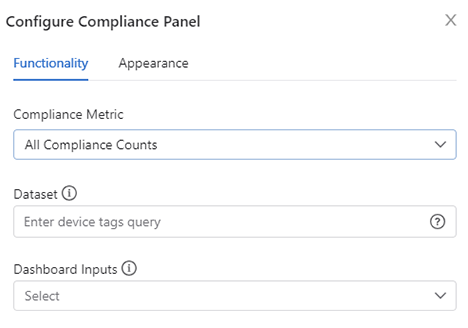
Compliance Panel
A new metric titled All Compliance Counts has been added to the Compliance panel.
This metric provides a table showing the count of all compliance issues for a
device.
Figure 11. All Compliance Counts
To select this metric, select All Compliance Counts under Compliance Metric.
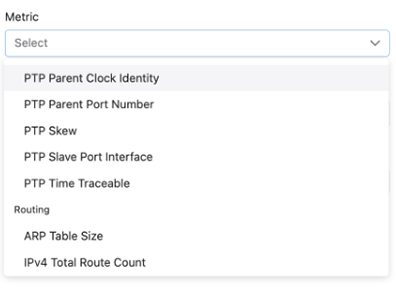
Select Metrics in the dropdown and choose an appropriate data visualization.
Figure 13. Select Metrics
Click on the empty panel to configure it.
Click PTP Slave Port Interface in the dropdown to populate the dashboard
panel. The data visualizations that appears here will be the same as those
displayed in Devices.
Figure 14. Select PTP Slave Port Interface
Click Save.
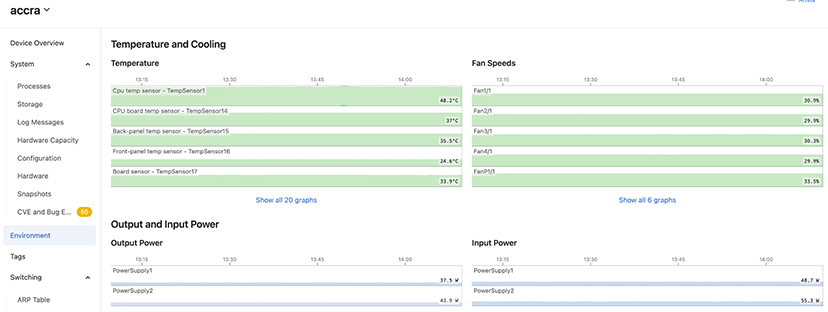
Device Input Power
Using Dashboards, you can monitor a device by displaying graphs for temperature, power
supply, and fan speed. Power Supply shows the power used at each power socket on the
device.
To view the input power of a device, navigate to Devices > Inventory >
(Device) > Environment.
Figure 15. Device Input Power
Note: You can also view input power via the Device Power
Consumption built-in dashboard in Dashboards.
Dashboard Layouts
Layouts provide you with additional ways to structure and control the layout of your
dashboards by combining panels into a single display.
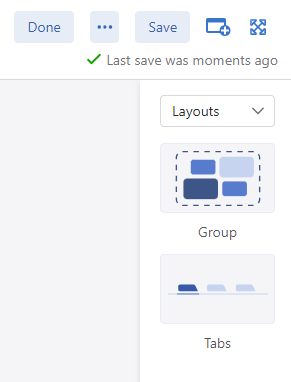
Group Layout
The Group layout helps you organize your dashboard by adding other panels to it. You can
group related panels together as a single unit in the dashboard.
The size and position of a group panel are controlled in the same way as other
panels.
Select Layout from the toolbox dropdown.
Select Group from the available options.
Figure 16. Select Group from the Layout menu
Move existing panels to the Group Panel by clicking the ellipsis (three dots)
and selecting Move to.
Figure 17. Select Move To
Add new panels by dragging and dropping them into the group panel.
Tabs Layout
The Tabs layout is used to order a selection of other panels as tabs. Clicking on a tab,
will display that panel. This allows you to maximize space in a dashboard and group
similar panels together.
The size and position of a tab panel are controlled in the same way as other panels.
Select Tabs from the Layouts from the toolbox.
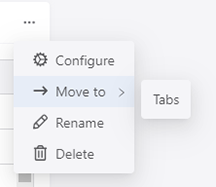
Move existing panels to the Tabs Panel by clicking the ellipsis and selecting
Move to.
Figure 18. Move to Tabs
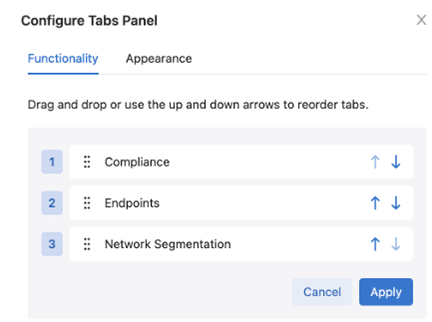
You can rearrange the order of the tabs by configuring the tabs layout.
Figure 19. Configure Tabs
Drag and drop the tabs to rearrange their left-to-right order.
Packaging for Dashboards
In addition to change control actions, users can now package custom dashboards, export
them from one CloudVision cluster, and install them in another. Package IDs and version
numbers can be used to update existing packages with version control.
All packages show the package name, version, and the number and type of components that
are included. Hovering over an action icon or a dashboard icon displays the name of
packaged components.
Once you have entered a package name, unique package ID, and a description, click
Add Component and use the dropdown to select the dashboards to include in
the package. Selected dashboards will appear under Contents.
Note: Dashboards and change control actions can be packaged
together, though components in the same package should be closely related to one
another.
The configuration guide is no longer being updated. Please refer to the CloudVision Help Center going forward.
Topology View
You can view the network hierarchy for the devices and subnetwork in real-time. The
topology view is available for devices running on LLDP including Arista switches and
connected neighbors.
You can customize the topology by completing the following steps.
Click the
Topology tab to view your network.
To enter layout hints, click on a device in the topology view and
then click on the layout tab.
Following example shows the detail of a device.
Figure 1. CVP Detail Layout
Overlays
CloudVision provides more than 20 overlay options to help you visualize the properties of
network devices, interfaces, and links.Each overlay uses a color scale to signal
variations in the values of selected properties and color coding to highlight devices or
containers with selected properties. When you choose an overlay, a color key will appear
in the display to help you read the visualization.
You can superimpose link-level metrics overlay onto the network topology. Use the Layers
Panel to view these overlays and color-codes based on the severity of that metric.
Following are the overlays supported in this release.
The following table lists the Overlays supported in this release.
Note: Descriptions not provided in the list are available in the
application.
Table 1. Supported Overlays
Overlay
Description
None
Turns off all colors.
Active Events
Bandwidth Utilization
Shows the bitrate as a percentage of the speed of the link. It uses
the maximum bitrate in either direction on the link, averaged out over a
one-minute window. Light green indicates a small percent of the link is
being used, while darker greens indicate higher usage. Beyond 80%
utilization, the links show up in yellow or red.
Cloud Segments
Discard Rate
Indicate that a link is dropping packets, likely due to congestion.
Links discarding more packets in a one-minute window are shown in darker
red.
DPS Tunnel Health
DPS Tunnel IP Sec Configuration
DPS Tunnel Jitter
DPS Tunnel Latency
DPS Tunnel MTU
DPS Tunnel Packet Loss
DPS Tunnel Service Provider
DPS Tunnel Throughput
Traffic Throughput
Shows the bitrate of a link as an absolute number. Darker blues
indicate higher utilization.
Error Rate
Show if either end of a link is registering input or output errors
(for example, CRC Errors). It uses a one-minute window, and displays
severity in increasingly dark reds.
Operational Status
PTP
CloudVision will color links and devices actively participating in
PTP. Each color is associated with a grandmaster ID whose identifier is
displayed in the color key. Inferred PTP links between devices are
designated with a dotted line and arrows on the links show the direction
of PTP clock inheritance.
Segmentation Dropped Packets
Segmentation Forwarded Packets
Speed
Traffic Throughput
Shows the bitrate of a link as an absolute number. Darker blues
indicate higher utilization.
User Tags
Virtual Topologies
VLANs
VRFs
VXLANs
WAN Device State
WAN VirtualTopology Status
Custom Topology Views
From the Topology tab, you can perform the following steps to customize a view:
To move a rack to a different pod use the Pod field. For example, the switch
called cv-demo-sw3 is set to be in a pod 1.
Figure 2. User Layout Hints
To setup the pod or rack names, apply a layout hint for switch with alternate
name or pod hint for the spine switch to rename the pod. Following example shows
the top-of-rack switch cv-demo-sw3 default name change via the rack layout
hint.
Figure 3. Device Details in Layout
Changing the Node Type
The following table lists the node types supported by the Topology view.
Table 2. Supported Node Type
Node Type
Description
Edge Device
The device is an edge device, for example, leading to the
Internet or another network, or a similar function device.
Core Switch
The device is at the core level switch (above spines) or similar
function device.
Spine Switch
The device is a pod level (spine or aggregation) switch or
similar function device.
Leaf Switch
The device is a top of rack switch or similar function device.
Endpoint Device
The device is a server or similar endpoint device.
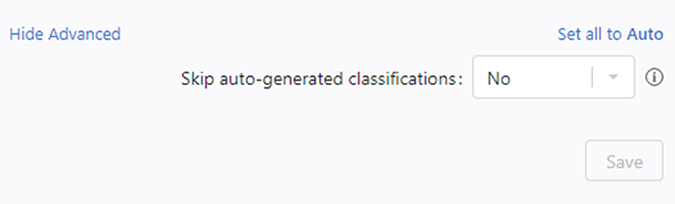
Setting the Node Type layout hint gives the Topology view of the type of device
selected. Selecting skip auto-generating forces the auto tagger to ignore the
device and not assign or modify any of the hints. Figure 4. Changing Node Type
Nodes and Features
Nodes are arranged in clusters. To expand a cluster, click on the representative
Cluster-node. To collapse a cluster, click on the minus (-) icon.
You can select various overlays on the graph for color coding links.
To see details about a node and its neighbors, click on the Node. You can also see
the immediate neighbors of the device and the metrics related to particular physical
links between devices by clicking Neighbors List.
The configuration guide is no longer being updated. Please refer to the CloudVision Help Center going forward.
Topology Hierarchy Manager
Using Topology Hierarchy Manager you can construct a custom topology frameworks for your
network.This allows you to customize the topology layout and how devices are mapped. A
custom hierarchy is constructed in a tree-like formation consisting of layers. Each
layer is associated with a tag label or value, which can be assigned in Topology using
Topology Tags and Hints. Multiple hierarchies can be used in the same CloudVision
cluster, so you can display different areas of your network differently.
To Access Topology Hierarchy Manager go to the Topologoly tab.
Click the Topology Settings icon.
Figure 1. Accessing Topology Hierarchy Manager
Click Edit under Topology Hierarchy.The Topology Hierarchy Manager opens.
Figure 2. Topology Hierarchy Manager
Topology Hierarchy Manager Layout
The Topology Hierarchy Manager has three key areas, which perform different functions
when configuring a custom topology hierarchy.
Network Hierarchies: Lists all hierarchies available to use. Those with
lock icons are built-in hierarchies and cannot be edited.
Selected Hierarchy: The center panel displays the layers of a selected
hierarchy, which can be edited when it is a custom hierarchy.
Layer Properties: The third panel displays the properties of a selected
layer.
Configuring a Topology Hierarchy
Click New.
Figure 3. Topology Hierarchy Manager
Enter the hierarchy details.
Figure 4. Topology Hierarchy Manager - New Network
Name: Enter a name for the hierarchy.
Description: Add a description to explain the purpose of this
hierarchy.
Existing Framework: You can duplicate an existing hierarchy
or set this option to None to start with a blank hierarchy.
Click … (ellipsis) on the root layer and select Add Sublayer.
Note: You must hover over the layer name before you
will see the Options …
Figure 5. Add Sublayer
The root layer is the top layer of the hierarchy. You can change its name
by configuring its layer properties.
Continue to add layers to match the layout of the hierarchy.
Figure 6. Continue to Add Layers
Layer names and their display managed and when configuring a layer’s
properties. When your topology is mapped out and each layer’s properties
configured, you can use the custom hierarchy.
Configuring Layer Properties
The properties of a layer determine how devices map to it and how it is displayed in the
topology.
Enter a tag label or device role.
Figure 7. Enter a Tag Label
The name of this input dynamically changes depending on whether it has
children or not. A layer without children will accept a device role, which
is a tag value. Any parent layer will accept a tag label. Tag labels are
used to provide hints, which will map devices with device tags that match. A
tag is a label:value pair. So assigning a tag label to a parent layer and a
device role to child will create a label:value pair, like
DC1:leaf.
Enter an optional display name.
Figure 8. Enter an Optional Display Name
The default display name is the tag name or device role.
Select a display alignment.
Figure 9. Select a Display Alignment
Enable or disable Aggregate Siblings with the Same Tag.
Option only
available on parent layers..
Select a sibling display alignment.
Figure 10. Select Sibling Display Alignment
Enable or disable Collapsible.
Select a cluster icon.
Figure 11. Select a Cluster Icon
The layer icon is displayed for the container or devices matching this
layer. Once the hierarchy layers have been arranged and their properties
configured, you can use the custom hierarchy for your topology.
Using a Custom Topology Hierarchy
Custom hierarchies can be used with Topology Tags and Hints to configure your network.
Topology Tags are used to assign and match existing devices and containers with child
layers in the custom hierarchy. Hints use the parent’s tag label and child’s device role
to automatically assign devices with matching user tags.
Click Topology Tags.
Figure 12. Click Topology Tags
Select one or more devices or containers.
Figure 13. Select One or More Devices or Containers
Select the custom hierarchy from the Hierarchy dropdown.
Figure 14. Select the Custom Hierarchy
Select a device role in the Device Role dropdown.
Figure 15. Select a Device Role
Devices in this selected container are now assigned the layer properties
of office1 in hierarchy building3..
Optionally provide tag hints for parent layers.
Figure 16. Provide Tag Hints
When a device with a user tag matching the parent layer tag label and one
of that parent’s children’s device roles, it will be automatically
positioned in the topology. In this example, if a device has the tag
Floor1:office1 it will occupy the same position in the topology
as what we assigned to the above container.
Click Apply.
The selected devices or containers will now apply the layer properties to all affected
devices.
The configuration guide is no longer being updated. Please refer to the CloudVision Help Center going forward.
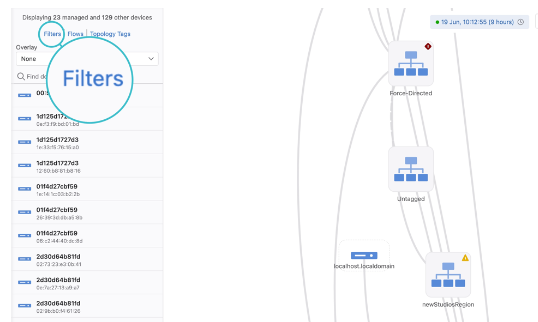
Topology Filter Builder
A filter is used to exclude devices from the topology view. When a filter is enabled, a
notification will be displayed in the topology view.
You can create permanent filters, which are saved in the Filters section of Topology.
These filters can be enabled or disabled at any time. Filters are useful for only
showing selected VLANs, VXLANs, or tagged devices in your topology.
Managing Topology Filters
You can access your filters when you want to enable or disable a filter, create a new
filter, or delete an existing filter.
In the Topology tab select Filters.
Figure 1. Accessing Topology Filters
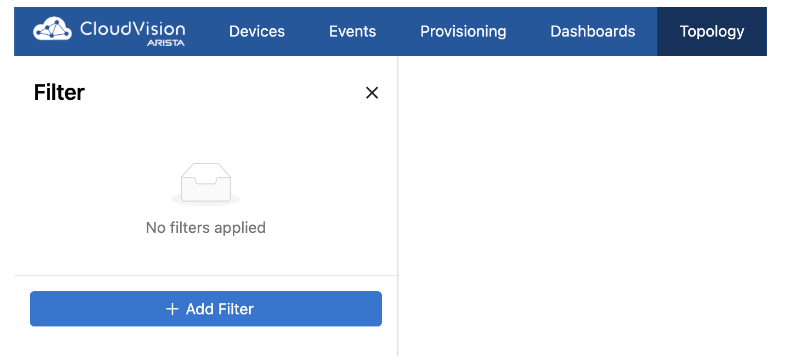
Click Add Filter.Figure 2. Add Filter
Edit the value of an existing filter or click Delete to delete a
filter.
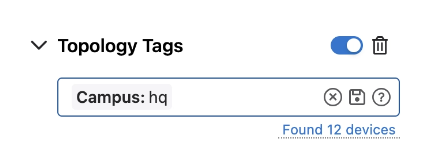
If adding a new filter, select a filter type from the dropdown menu.
There are
three filters to choose from:
Topology Tags: Enter a tag query to only display devices with
matching tags.
Figure 3. Topology Tags Filter
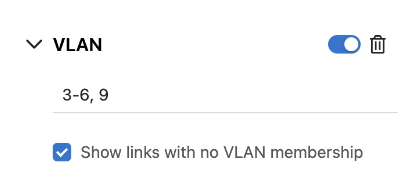
VLAN: Enter a VLAN ID or range to limit the display to devices in
one or more VLANs.
Figure 4. VLAN Filter
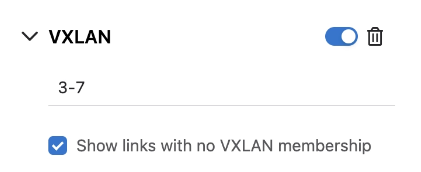
VXLAN: Enter a VNI or range to view devices belonging to a selected
VXLAN or VXLANs.
Figure 5. VXLAN Filter
Filtering by VLAN and VXLAN membership also allows you to show
or hide links that do not belong to a VLAN or VXLAN. To show links that do
not belong to a VLAN or VXLAN, select the appropriate checkbox. Disable it
to hide them from the display.
Press Enter if defining a VLAN or VXLAN filter.The values are saved to
the filter.
You can enable and disable filters by toggling them on or off. Filters can be deleted at
any time by clicking Delete.
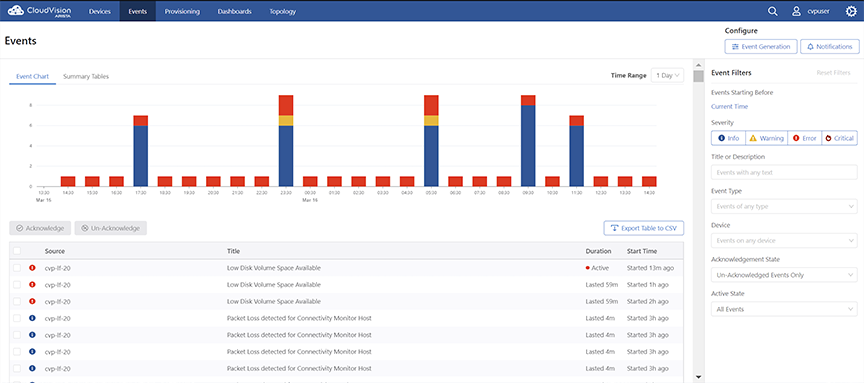
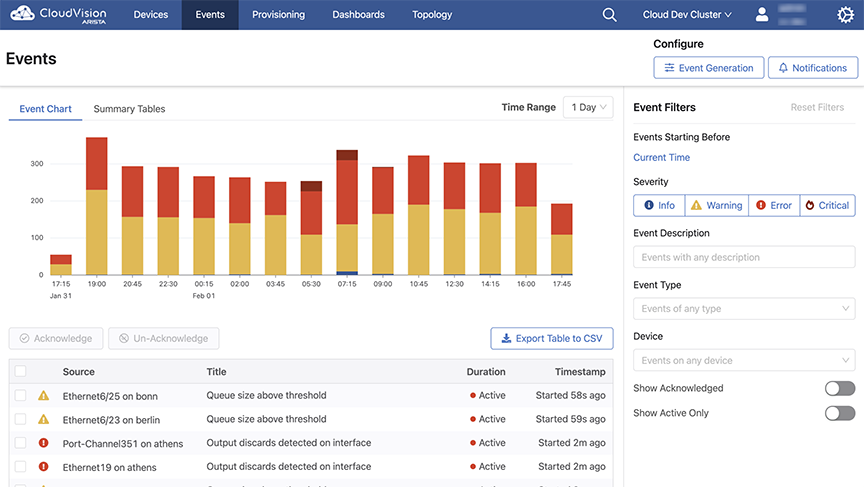
The events summary screen displays all events, and configures alerts and event generation. To
view this screen, click Events on the CloudVision portal. The figure below
displays the events summary screen.Figure 1. Events Summary Screen
The
Events screen provides the following information and
functionalities:
The Event Chart tab displays the bar
graphs of all events.
Note: Hover the cursor over the different
segments of the bar graph to view the count of severity
events.
The Summary Tables tab displays
Most Active Devices and
Most Active Event Types in tabular
formats.See the figure below.Figure 2. Event Summary Screen - Summary Tables
Note: The severity levels include critical, error,
warning, and info.
The Time Range dropdown menu to select the time
span of events.
The Acknowledge button to acknowledges selected
events.
The Un-Acknowledge button to renounce selected
events.
A list of all events with selection checkboxes in a tabular format.
Click the Export Table to CSV button to download
the table in csv format to your local drive.
Right Pane
The Reset Filters button to clear all filtering
options.
The Current Time date picker to select the event
start date.
Search field based on Title or Description and
dropdown menus based on Event Type,
Device, Acknowlegement
State,and Active State.
Buttons to perform a search based on severity levels
(Info, Warning,
Error, and Critical)
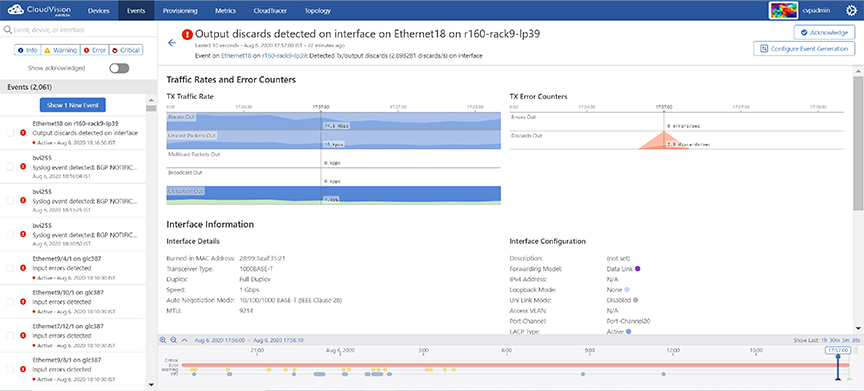
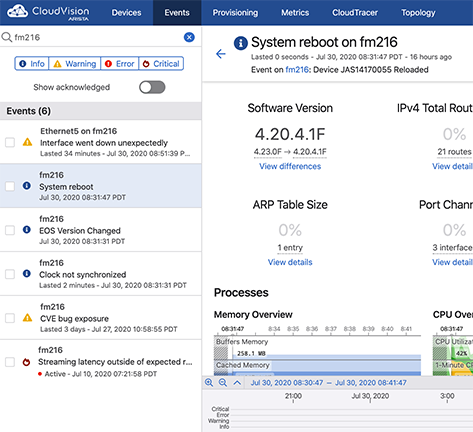
Event Details Screen
An event details screen displays appropriate event details, acknowledges the event, and
configures event generation. To view this screen, click one of the events listed on the
Events screen. Figure 3. Event Details Screen
This screen provides the following information and functionalities in
the right pane:
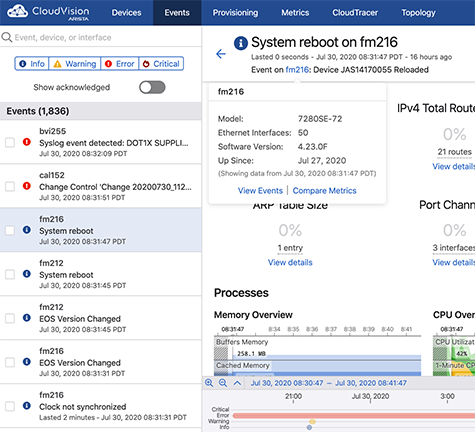
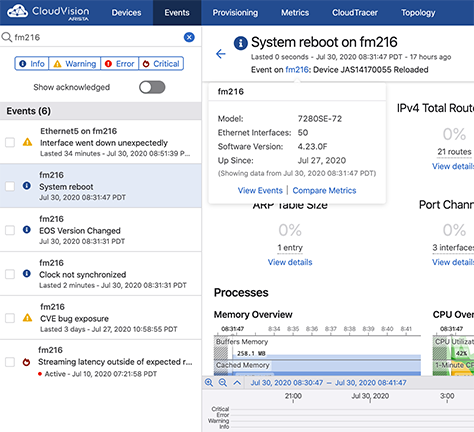
Hover the cursor on the
event name. The system displays a popup window with event details.
Figure 4. Event Name Popup Window
The popup window provides the following options:
Click View Events to view search results with
the same event name.
Figure 5. Search Results with the Same Event Name
Click
Compare Metrics to navigate to the
Explorer tab in Metrics app.
Hover the cursor on the
event name. The system displays a popup window with device details in that
location.
Figure 6. Location Name Popup Window
The popup window provides the following options:
Click
View Events to view search results with the same location name.
Figure 7. Search Results with the Same Location Name
Click
Compare Metrics to navigate to the
Explorer tab under
Metrics.
The
Acknowledge button to acknowledge the appropriate event.
The
Configure Event Generation button to configure the generation of
appropriate event.
Metric details of the event
A chronological history of
all errors (shown at the bottom of the screen)
Configuring Event Generations
Configure rules and conditions to customize event generation.
Perform the following steps to configure the settings for generating
events:
On the CloudVision portal, click the
Events tab. The system displays the
Events screen.
Click
Configure Event Generation at the upper right corner of the
Events section. The system displays the
Generation Configuration screen with all configurable events
listed in the left pane.
Figure 8. Generation Configuration Screen
Note: Alternatively, you can go to an event details screen and click
Configure Event Generation to configure rules for generating
events.
Click the required event in the left pane.
Click
Add Rule in the lower end of right pane. A new
Condition pane is displayed on the screen.
Figure 9. Add Rule Pane in Generation Configuration
In the
Condition pane, click on the search field. The system displays
the list of configured devices tags.
Figure 10. List of Configured Device Tags
Note: Alternatively, you can type the required device tag in the
search field for a quick search.
Select preferred devices tags from the displayed list.
Note: After you have selected the device, the system displays the
count of matched devices. The rule is applicable to all devices when you do not
select any device tag.
Click on the Interfaces search field (available only for interface
events).
The system displays the list of configured interface tags..
Figure 11. List of Configured Interface Tags
Select preferred interface tags from the displayed list.
Note: After you have selected an interface tag, the system displays the count of
matching interfaces. The rule is applicable to all interfaces when you do
not select any interface tag.
Provide the following criteria required to generate events:
Severity -
Select the severity type from the drop-down menu. Options include
Info,
Warning,
Critical, and
Error.
Threshold
(applicable only to threshold events) - Type the threshold value.
Raise Time - Type the preferred wait time (seconds) to
create an event after reaching the threshold limit.
Clear Time -
Type the precise time (seconds) to delete an event after the current value goes
below the threshold limit.
Note: Select the
Stop generating events and checking rules checkbox if you do
not want to apply further rules for selected tags. If no tags are selected,
further rules are not applicable to any device.
Click
Move up if you prefer to move this rule up in the priority
list.
Note: Rules are processed sequentially. The default rule is applied
only when an event does not match any other rules. Click
Delete rule to delete the corresponding rule. Click
Move down in configured rules to move the corresponding rule
down in the priority list.
Click
Save in the left pane.
Note: Click
View Configuration Differences in the lower left pane to
view differences in event configurations.
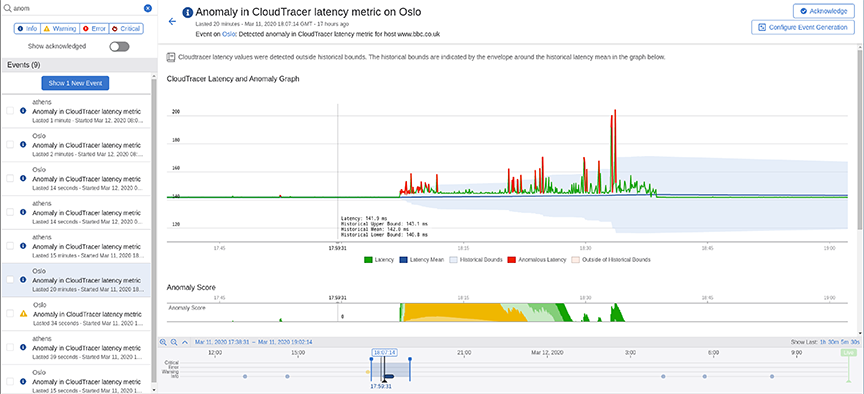
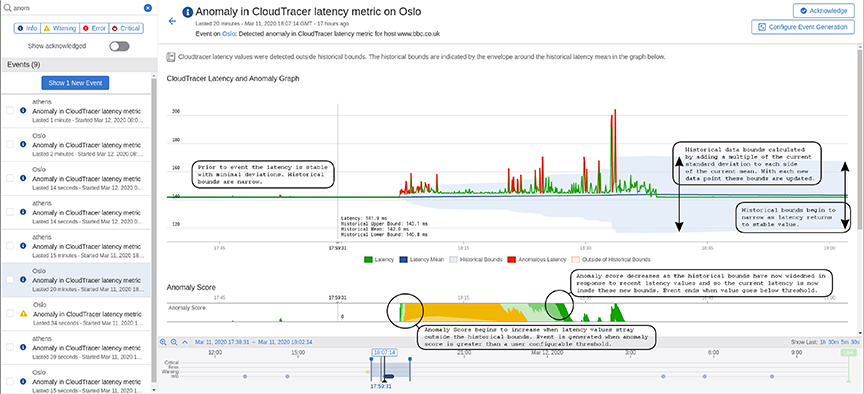
Anomaly in Connectivity MonitorLatency
From the Events tab, select Anomaly in Connectivity MonitorLatency to configure event
generation for latency events between devices and configured hosts. The events are
designed to alert the user when the latency between a device and a configured host is
outside of recent historical bounds.
Figure 12 is a sample event view for one of these events between the
device with hostname `Oslo` and the cloudtracer host endpoint `www.bbc.co.uk`.
Prior to this event in
Figure 13, the latency metric (green line in upper graph) is stable with
minimal deviations. The historical bounds (blue shaded region) that determine
when the metric is in a normal state has a small range with both the upper and
lower bounds near the historical mean (dark blue line). The historical bounds
are computed by adding and subtracting a fixed multiple of the current latency
standard deviation to the current mean.
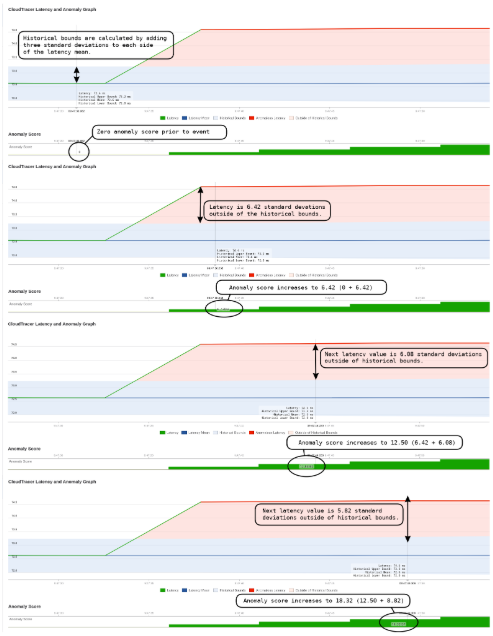
The anomaly score starts to increase from zero when the latency value
strays outside of the historical bounds. The latency values that are outside
the bounds are highlighted in red. The anomaly score is the total number of
standard deviations outside the historical bounds. The anomaly score is the
positive cumulative sum of the number of standard deviations outside of the
historical bounds. For example, if the bounds are set as 3 standard deviations
outside of the mean and we get a value of the latency that is 5 times the
standard deviation away from the mean, the anomaly score will increase by 2. If
the next latency value was 1.5 times the standard deviation outside of then
mean then we would subtract 1.5 from the anomaly score. The anomaly score
therefore keeps track of the cumulative deviation of the latency outside of the
historical bounds. It is bounded below by zero.
Figure 14 provides a detailed explanation on computing the anomaly score.
Figure 14. Anomaly Score Computation
The event is generated when the anomaly score exceeds a threshold for a
set period of time.
Note: You can configure the threshold and time duration in the event
configuration rules.
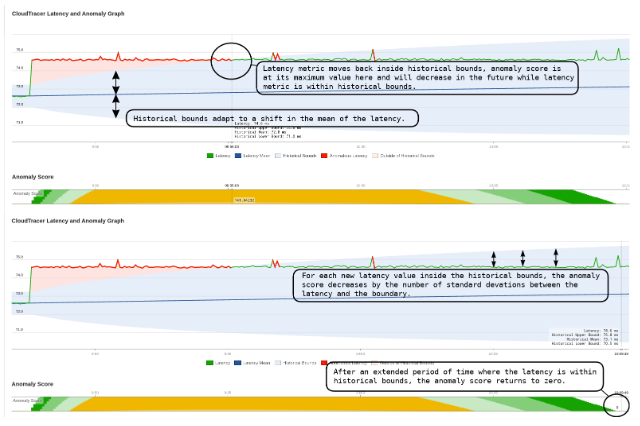
The anomaly score starts to decrease when the latency values are inside
the historical bounds. The historical bounds have increased based on recent
deviations in latency which makes the system less sensitive than prior to the
event. The event ends when the anomaly score is below the threshold for a set
period of time.
Figure 15 provides a detailed explanation of the anomaly score decreasing
when an event ends.
Figure 15. Decreasing of Anomaly Score
At the end of the time range, historical bounds are narrowing as the
latency has now returned to a stable value with minimum deviations. The history
needs approximately six hours to have negligible impact on the statistics and
bounds.
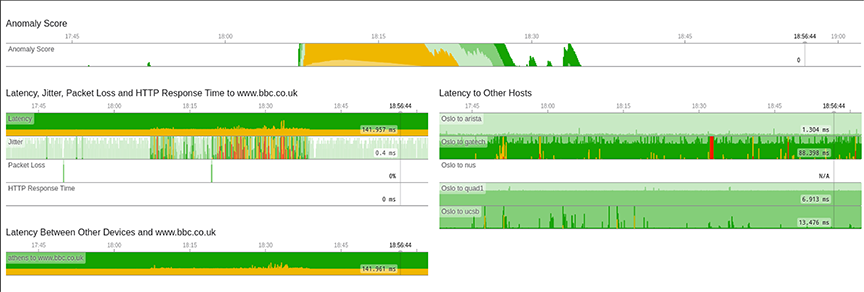
This screen also provides the following additional metrics of this event
(see
Figure 16):
The other CloudTracer metrics are displayed for this device and host
pair
The latency metric between other devices and this host
The latency metric between this device and other hosts
Figure 16. CloudTracer Event Additional View
Custom Syslog Events
The Custom Syslog Event creates syslog message events based on rule
conditions. To end all similar active events, you must update the configuration as
per the recommended action provided in the EOS System Message Guide.
An EOS System Message Guide is published with every EOS release. In the guide, you
can find all the common system messages generated by devices, including the syslog
facility, mnemonic, severity, and log message format. To download the guide, click
https://www.arista.com/en/support/software-download and
look for SysMsgGuide under EOS release Docs.
Note: Rules are processed sequentially. Events that don't match user created rule
conditions are processed by default rule(s).
Perform the following steps to create a rule for generating syslog events:
On the CloudVision portal, click the Events tab. The system displays the
Events screen.
Click Configure Event Generation at the upper right corner of the
Events section.
Note: Alternatively, you can go to an event details screen and click
Configure Event Generation to configure rules for generating
events.
The system displays the Generation Configuration screen with all
configurable event types listed in the left pane.
Click Custom Syslog Event.
Figure 17. Custom Syslog Event Screen
Click +Add Rule in the right pane.
A new condition pane is displayed on the screen.Figure 18. Conditions Pane for the Custom Syslog Event Rule
Provide the following information in specified fields:
Active devices autocomplete field -
Generate an event for these conditions checkbox -
Choose either Single Instance Events or Time Period Events using
the toggle button.
Based on your choice between single instance events and time period events,
provide the following relevant conditions for generating a rule:
Note: The corresponding fields appear after you choose the required event
type.
Save Changes button - Click to save specified changes.
Configuring Single Instance Events
CVP creates a single instance event whenever either the specified syslog ID matches
with the device syslog ID or the specified syslog message matches with the device
syslog message. See Custom Syslog Events.
Provide the following information in specified fields to configure a single instance
event:
Syslog ID - Provide facility, severity, and mnemonic of a syslog with
regular expressions in the following fields:
Facility field - Type the facility of syslog in either simple
string or regular expression.
All severities field - Select the severity of the device.
Note: If
no severity is selected, CVP considers all available
severities.
Mnemonic field - CVP creates a single instance event when the log
message specified in this field matches with a device syslog
message.
Log Message field - The log message to match against the device syslog
message.
Note: You must mandatorily configure either a syslog ID or a log
message.
Mute Period field - CVP does not create another similar event using this
rule on a given device until the time period specified in this field expires for
the ongoing event.
Note: This prevents a large number of events generated for
the same device within a short period of time due to a repetitive syslog
message.
Event Title field - Type the event title.
Severity From Syslog checkbox - Select the checkbox if you prefer CVP to
select the severity of the generated event to be derived from the syslog message
severity.
Note: CVP uses the following syslog message severities to event
severities:
[0, 1, 2] - Critical event
[3] - Error event
[4] - Warning event
[5,6,7,...] - Info event
Severity dropdown menu - Select the preferred severity of the generated
event. Severity is configurable only when Severity From Syslog checkbox
is not selected.
Event Description field - Provide the event description.
Ignore subsequent rules for selected devices checkbox - Select the
checkbox to suppress generating events for a specific syslog or override
upcoming configurations.
Move Up / Move Down buttons - Use this button to manage the
sequence of configured syslog event rules.
Delete button - Click to delete the corresponding rule.
Note: Syslogs with high severities like 0 (Emergency), 1 (Alert), 2 (Critical), and 3
(Error) generate events by default unless they are ignored by user configured
rules.
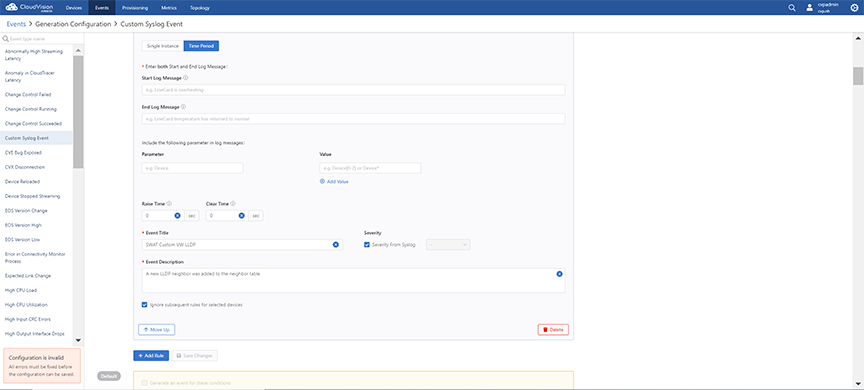
Configuring Time Period Events
Events can also be configured to be time period events that remain active
between the syslog message that creates it and the syslog message that ends the
event. See the figure below.Figure 19. Configuring Time Period Event
Provide the following information in specified fields to configure a
time period event:
Start Log Message field - CVP starts a time period event when the start
log message specified in this field matches with a device syslog
message.
Note: The start log message must be a string without special
characters.
End Log Message field - CVP ends a time period event when the end log
message specified in this field matches with a device syslog message.
Note: The
end log message must be a string without special characters.
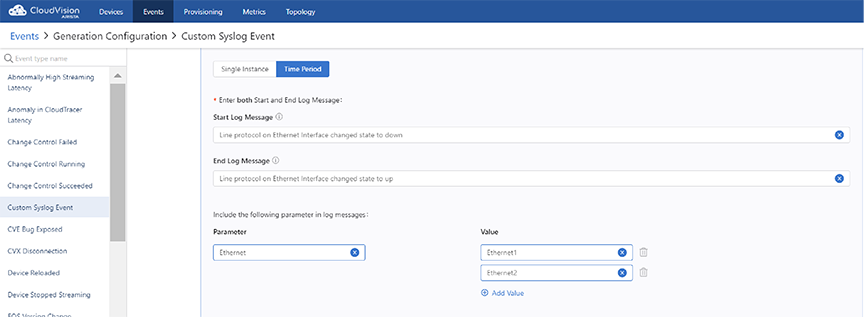
Parameter field - Type the variable that must be configured in log
messages specified in the Start Log Message and End Log Message fields.
Value field - Type a variable for the specified parameter in
either a simple string or a regular expression.
Add Value - Click to add another variable for the specified
parameter.
Ethernet is a parameter with values as
Ethernet1 and Ethernet2. See the figure below.
In this case, the specified log messages matches with Ethernet1 and Ethernet2
values for either starting or ending an event.
Figure 20. Example1 of Parameter Variables
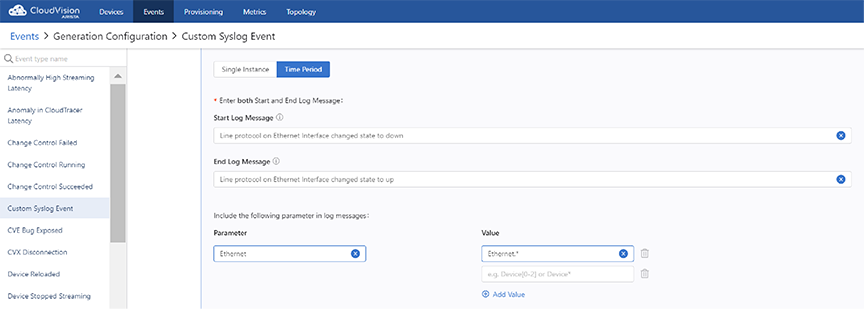
Ethernet is a parameter with a value as
Ethernet.*. See the figure below.
In this case, the specified
log messages matches with all ethernet values like Ethernet1, Ethernet1/2,
Ethernet1/3, and so on for either starting or ending an event.
Figure 21. Example2 of Parameter Variables
Raise Time field - After a start rule matches, the starting of an event
is delayed for the duration specified in this field.
Note: If the end event log
message arrives before this delay elapses, the event is not generated. This
option is useful in situations where you wish to generate an event only when
a syslog condition has persisted for at least some set period of
time.
Clear Time field - After an end rule matches, the ending of the ongoing
event is delayed for the duration specified in this field.
Note: If the start
event log message arrives before this delay elapses, the event is not ended
and will continue as an active event. This option is useful in situations
where you wish to generate a long single event which may encompass several
start/end conditions being met during a set period of time.
Event Title field - Type the event title.
Severity From Syslog checkbox - Select the checkbox if you prefer CVP to
select the severity of the generated event to be derived from the syslog message
severity.
Note: CVP uses the following syslog message severities to event
severities:
[0, 1, 2] - Critical event
[3] - Error event
[4] - Warning event
[5,6,7,...] - Info event
Severity dropdown menu - Select the preferred severity of the generated
event. Severity is configurable only when Severity From Syslog checkbox
is not selected.
Event Description field - Provide the event description.
Ignore subsequent rules for selected devices checkbox - Select the
checkbox to suppress generating events for a specific syslog or override
upcoming configurations.
Move Up / Move Down buttons - Use this button to manage the
sequence of configured syslog event rules.
Delete button - Click to delete the corresponding rule.
Note: A configuration change in the current rule ends all ongoing events.
Rule Labels
Rule Labels are optional conditions in Event Notifications for sending notifications to
receiver platforms. Using rule labels allows you to create more complex notification
rules in relation to generated events. An event can be generated with a rule label,
which is configured and created in Event Generation. That label can be added as a
condition to a rule in Event Notifications for sending an alert to a platform receiver.
A rule label is created in Event Generation, which creates events in CloudVision.
The label can be assigned as a condition in a rule for Event Notifications.
Add or select a rule in Event Generation.
Figure 22. Add Rule Label
Add a rule label in the Rule Label field.
Assigning a Rule Label
You can assign rule labels that have been created in Event Generation to rules in
Notifications. When an event is generated with a rule label, notifications will only
be sent if the rule label matches the event generated rule label.
The notification rule will only generate an event that has a rule with a label that
matches the selected rule label.
Add or select a rule in Event Notifications.
Figure 23. Assigning a Rule Label
Click Rule Labels and select one or more existing rule label.
Figure 24. Notification Rues
Platform Settings Overrides
When adding a receiver in Event Notifications, you can override existing platform
settings in Platforms. This allows you to add default platform settings in Platforms
and then use different settings when creating a receiver. You can have multiple
settings for the same platform on a per-receiver basis.
Upon completion for the following steps, the receiver will use the override settings
instead of the default settings created in Platforms.
Add or select an existing receiver.
Figure 25. Add or Select an Existing Receiver
Click Platform Settings.
Enter custom settings for the selected platform.
Figure 26. Custom Settings for Selected Platform
Click Save.
Compliance Events
Events will be generated when a provisioned device’s running configuration or image is
out of sync with the designed configuration or image on CloudVision via the system's
continuous compliance checker. This can occur when configuration or an image is pushed
to a device outside of CloudVision, which prevents CloudVision from being the source of
truth for device configuration.
Alerts will continue to be shown in Inventory, Compliance Overview, and Network
Provisioning when a device is non-compliant.
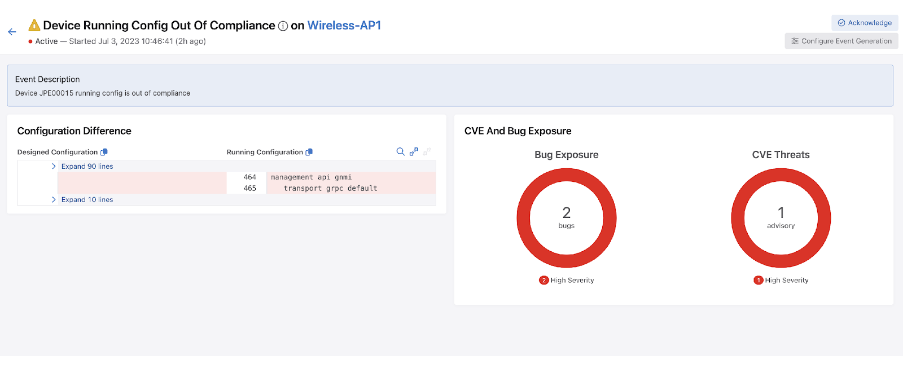
Device Running Config Out of Compliance
A Device Running Config Out Of Compliance event is generated when CloudVision detects
that a device’s running config is out of sync with its designed config on
CloudVision. The event layout will show the running and designed configuration,
along with related information about the compliance of the device, including the
bug/security advisory exposure of the device.
Figure 27. Device Running Config Out of Compliance
The event has a Warning severity.
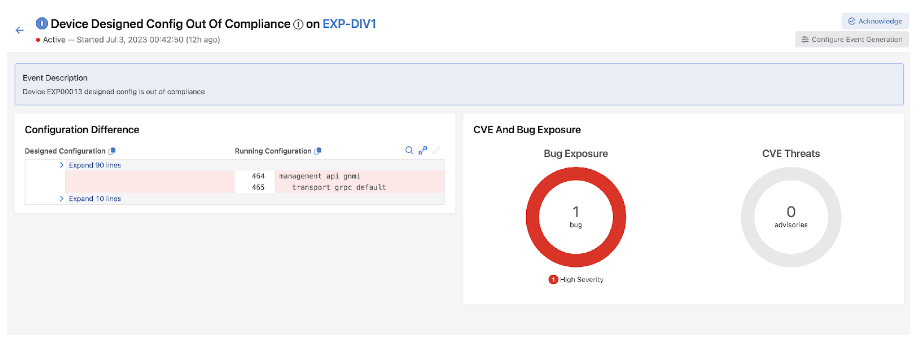
Device Designed Config Out of Compliance
A Device Designed Config Out of Compliance event is generated when the designed
configuration for a device is out of sync with a device’s running configuration.
This occurs when configuration created on CloudVision has not been pushed to a
device.
Figure 28. Device Designed Config Out of Compliance
The event has an Info severity.
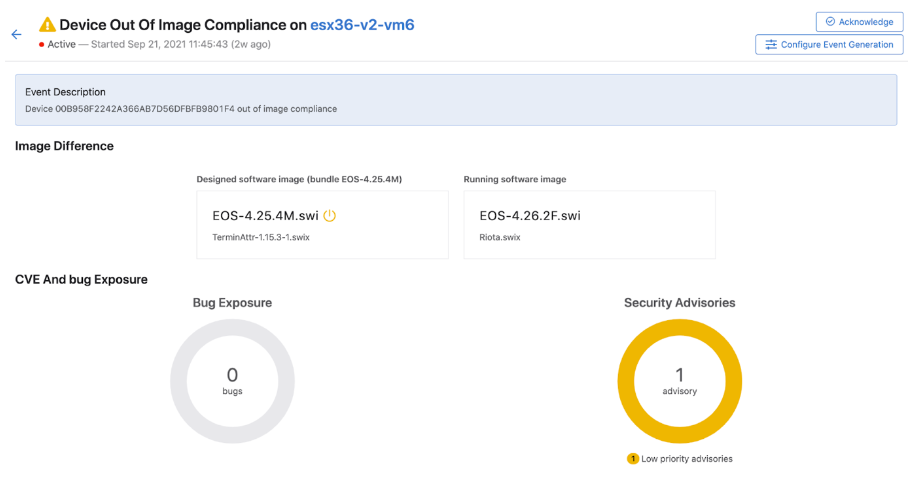
Device Image Compliance
A Device Image Compliance event is generated when a device’s designed and running
image are out of sync. You will need to upgrade the correct image for the device on
CloudVision and, if required, push the image to the device.
Figure 29. Device Image Compliance
The event has a Warning severity.
Managing Events
You can manage an event by customizing event rules differently. Refer to the following
examples:
Perform the following steps to disable all events of the selected
type:
Navigate to the
Generation Configuration screen.
Click the required event type in the left pane.
In the right pane, Click the
+ Add Rule button.
Note: Retain only one rule with no values defined. To disable the
event only for selected datasets, select appropriate devices tags in the
Devices field.
Select the
Stop generating events and checking rules checkbox.
The system disables all events of the selected event type.
Figure 30. Disable All Events of the Selected Type
Click
Save in the left pane.
Disabling All Events of the Selected Type with Exception
Perform the
following steps to disable all events of the selected type with exceptions:
Navigate to the
Generation Configuration screen.
Click the required event type in the left pane.
In the right pane, Click the
+ Add Rule button.
In the
Conditions pane, provide the device tags that you still want
to generate an event for. The system creates rule 1.
Note: If you need devices with different conditions, add another rule by repeating steps 3 and
4.
Click the
+ Add Rule button.
In the appropriate
Conditions pane, select the Stop generating events and
checking rules checkbox. The system creates rule 3.
Note: If you skip steps 5 and 6, the system applies default rules to
all device tags except the ones that are defined in rules 1 and 2.
Figure 31. Disable All Events of the Selected Type with Exception
The system disables all events of the selected type except the
ones that are defined in rules 1 and 2.
Acknowledging Events
Acknowledging an event confirms that you are aware of the
corresponding event and its consequences. By default, acknowledged events are
hidden and do not send alerts.
Perform the
following steps to acknowledge an event:
Click the
Events tab. The system displays the
Events screen.
Select preferred event(s) in the side panel.
Click Acknowledge n in the upper right corner of the side panel.
Note:n represents the count of selected events.
The system displays the Acknowledgment Event window. Figure 32. Acknowledgment Event Pop-Up
(Optional) Type a note for other users explaining the reason for the
acknowledgment.
Click Acknowledge n events where n represents the
count of selected events.
Note: For acknowledged events, the system replaces the Acknowledge button with
Un-Acknowledge button. To undo the acknowledgment activity, Click
Un-Acknowledge in the side panel of the acknowledged event.
Configuring Notifications
The event alerting system sends notifications for CVP events as they alert operating
platforms that you have set up. Once you have customized the topology view for your network,
provide the required information to configure the monitoring of notifications.
Perform the following steps to configure event alerts:
Click the Events tab.
Click Configure Notifications at the upper right corner of the Events
section. The system displays the Notification Configuration screen.
The
Status section configures monitoring the health of notification
system.
Perform the
following steps to configure the notification criteria:
Click
Status. The system displays the
Status screen.
Figure 33. Status Screen of Notification Configuration
On the
Test Alert Sender pane, provide the required criterion in
Severity,
Event type, and
Device drop-down menus.
If required, click
Send Test Notification to verify current configuration.
Configuring Platforms
The Platforms section specifies what platforms will receive
notifications.
Perform the
following steps to configure preferred platforms:
Click
Platforms. The system displays the
Platforms screen.
Figure 34. Platforms Screen of Notification Configuration
Configure any of the following platforms through which you prefer
to receive notifications from CVP:
Email
Provide the following information to receive email
notifications:
Type your SMTP
servers hostname and port number separated by a colon in the
SMTP Host field.
Note: Typically, the port numbers of SMTP and SMTP over TLS
are 25 and 587.
Select the
Use TLS for SMTP checkbox if you prefer to encrypt
notifications received from and sent to the SMTP server.
Type the email
address that you prefer to display as a sender in the
Email "From" Address field.
Note: We recommend an email address with the domain of your
organization.
Type the username
of your SMTP account in the
SMTP Username field.
Type the password
of your SMTP account in the
SMTP Password field.
Slack
Create a custom integration through the Incoming WebHooks
Slack application and type the Webhook URL in the
Slack Webhook URL field.
VictorOps
In your
VictorOps settings, add a new alert integration for
Prometheus and type the Service API Key in the
VictorOps API Key field.
If required, type
a custom API URL in the
VictorOps API URL field.
PagerDuty
If required, type a custom API URL in the
PagerDuty URL field.
OpsGenie
Create an API
integration for your OpsGenie team and type the API key in the
OpsGenie API Key field.
If required, type a
custom API URL in the OpsGenie API URL field.
Google Chat
In Google Chat the Alerter will send a message
containing one or more alerts and related information.Follow the
steps in the Google Chat for Developers
Guide to create a webhook, use the webhook URL to
configure the Google Chat platform on CloudVision.
Microsoft Teams
In MS Teams the Alerter will send a message
containing one or more alerts and related information.Follow the
steps in the Microsoft Teams - Create Incoming
Webhooks - document to create a webhook, use the webhook
URL to configure the Microsoft Teams platform on CloudVision.
Zoom
In Zoom the Alerter will send a message containing one or
more alerts and related information.Add webhooks and get
configuration information using the guide Using Zoom's Incoming Webhook
Chatbot, once you have the URL and verification token you
can enter them into the Zoom platforms settings on
CloudVision.
Sendgrid
Sendgrid is also available as an
alternative to email.On CVaaS, Sendgrid requires no configuration,
while for on-prem installations Sendgrid requires an API key and
from address. It uses the same content templates as Email.
Syslog
The Alerter will send a syslog message for each CVP
event. The syslog facility must be set in the configuration. The
syslog priority is mapped from the CVP severity and this mapping may
be customized in the configuration.
Syslog messages are
formatted with the following values:
Timestamp: The time that the event fired/was resolved.
Hostname: a comma-separated list of device hostnames from the
devices the event is related to.
Facility: from user configuration.
Severity: mapped from CVP severity according to user
configuration.
The Alerter will send an SNMP trap for each CVP
event, this supports SNMPv1, SNMPv2c and SNMPv3.The OID of the
SNMP Trap will use an OID from an Arista CloudVision Alerter
specific MIB ARISTA-CV-MIB.txt, the message is a string message
containing the necessary information.
Configuring Receivers
The Receivers section configures a receiver for each preferred team to
send notifications and link receivers to notification platforms.
Perform the following steps to add new receivers:
Click
Receivers. The system displays the Receivers screen.
Figure 35. Receivers Screen of Notification Configuration
Click
Add Receivers at the end of the screen.
Type receiver's name in the
Receiver Name field.
Figure 36. Add Receiver Pane
Click the
Add Configuration drop-down menu.
Select any of the options in following table and provide the
required information to link alert receivers with alerting platforms.
Table 1. Configuration Options
Configuration Options
Required Information
Add Email Configuration
Type recipient's email address in the
Recipient Email field.
If required, select the
Send alert when events are resolved checkbox.
Add VictorOps
Configuration
Type a routing key in the
Routing Key field.
If required, select the
Send alert when events are resolved checkbox.
Add PagerDuty
Configuration
Type a routing key in the
Integration Key field.
If required, select the
Send alert when events are resolved checkbox.
Add OpsGenie
Configuration
Select the
Send alert when events are resolved checkbox.
Add Slack Configuration
Type a channel in the
Channel field.
If required, select the
Send alert when events are resolved checkbox.
Add Pushover
Configuration
Type a recipient's user key in the
Recipient User Key field.
Type a pushover API token in the
Application API Token field.
If required, select the
Send alert when events are resolved checkbox.
Add Webhook
Configuration
Type the URL where you prefer to post event alerts in
the
Target URL field.
If required, select the
Send alert when events are resolved checkbox
Note: Click the recycle bin icon at the right end of corresponding
fields if you prefer to delete that configuration. Click
Delete Receiver next to
Add Configuration if you prefer to delete the corresponding
receiver.
Configuring Rules
The Rules section customizes notifications that are sent to
receivers.
Perform the following steps to add a new rule:
Click
Rules. The system displays the Rules screen.
Figure 37. Rules Screen of Notification Configuration
Click
Add Rules. A new Rules Conditions pane is displayed on the
screen.
Figure 38. Rule Conditions Pane
Next to
Add Conditions, click
Severity,
Event Type,
Device, and
Device Tags to provide the criteria that are used for
monitoring the health of the alerting system.
Note: Click
Remove at the end of a field to delete that configuration.
Select the required receiver from the
Receiver drop-down menu.
Select required checkboxes among Severity, Event Type, Device, and
Interface to group similar events into a single alert.
Select the
Continue checking lower rules checkbox to continue checking
for alerts if this event matches subsequent rules.
Click
Move up if you prefer to move this rule up in the priority
list.
Note: Rules are processed sequentially. The default rule is applied
only when an event does not match any other rules. Click
Delete rule to delete the corresponding rule. Click
Move down in configured rules to move the corresponding rule
down in the priority list.
The configuration guide is no longer being updated. Please refer to the CloudVision Help Center going forward.
Events App
The Events appprovides fast filtering results that are loaded 100 events at a time,
improving loading times and responsiveness compared to the existing Events app.
Event Summary
At the top of the app is the event summary. The summary has two tabs for the Event Chart
and the Summary Tables. There is also a time range duration picker that selects the
start of the time range for the summary results. The filters in the app sidebar also
affect the summary views, allowing the request of specific summary queries.
Figure 1. New Events App
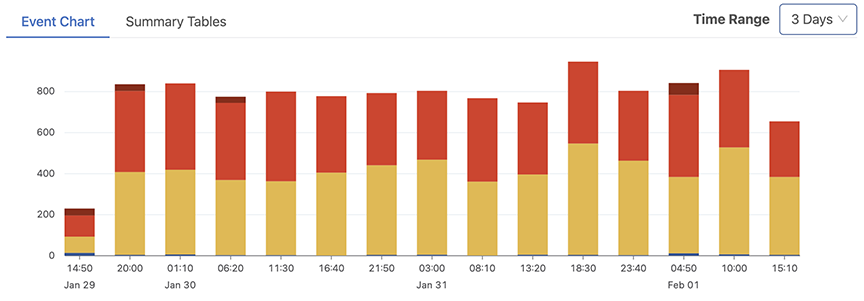
Event Chart
The default summary view is the Events Chart. This chart displays the number of
events that were created in a time range, broken down by severity. Hovering over a
colored section of a bar shows how many events occurred with that given severity. A
bar represents the events that were created within time range for that bar. . The
amount of time represented by a bar is dependent on the selected time range.Larger
time ranges will group more events into a single bar.
Figure 2. Event Chart Summary
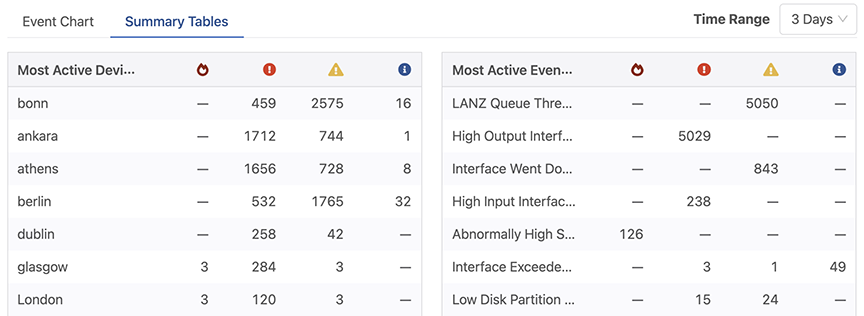
Summary Tables
The Summary Tables tab displays the events of the Events Chart in a table format.
Results can be filtered by severity value, device, or event-type.
Figure 3. Summary Tables
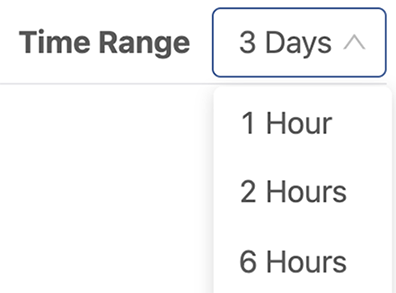
Summary Time Picker
In the top-right corner of the summary there is a time range picker. This affects the
summaries only. The end-time of the summary window is determined by the Events
Starting Before filter in the sidebar.The start-time is derived from the
chosen time range. The range picker has a minimum duration of one hour and a maximum
of one week.
Figure 4. Summary Time Picker
Events Table
Events matching the selected filters are displayed in the table below the summary.
Figure 5. Events Tables
The newest 100 events are initially loaded. Subsequent events are fetched via automatic
pagination. The Ack(Acknowledgement) column only appears if the Show
Acknowledged filter toggle is on. This allows other columns to expand when
acknowledgment information is not required.
Events Table Functionality
When scrolling down through the table of events, older events are
automatically fetched.
If there are no events matching the selected filters, the events table
will display an empty data message.
To update the display with events that may have occurred while viewing
the Events Table, select the Show New Events button.The screen
will be updated with the new data.
To export the currently-loaded events, select the Export Table to
CSV button.
Certificate Expiration Event
When the CloudVision SSL certificate is expiring an event will alert users 90 days in
advance of certificate expiration. Clicking on the event will provide further
information.To clear the event, the SSL certificate must be replaced.
Event Filters
Filter options are located in the sidebar.The selected filters affect the results in
both the events summary and the events table. Multiple filters can be selected to refine
the results shown in these sections. Filters are automatically applied as they are
changed in the sidebar.
Events Starting Before
The Events Starting Before time selector defines the end cutoff time filter
for events. Events that are created after the selected time will not be shown. By
default, the filter is set to the current time.
Select this filter to open the date-time picker, allowing an older time to be
selected.Select Apply to update with this new time filter. Select Use
current time to show live events.
Severity
Selecting an event severity will display only the selected severity level.
Event Description
The Event Description filter allows events to be searched by arbitrary text in
the event description field.
Event Type
When selected, the Event Types filter presents a list of all available event
types. Selecting one or more options filters the results to events of the selected
types.
Device
When Selected, the Device filter presents a list of all streaming devices.
Selecting one or more devices will display events that occurred on the selected
devices.
Show Acknowledged
Select Show Acknowledgedto view events which have been previously
acknowledged.
Active Events Only
Select Show Active Onlyto view events which are still active.
Resetting Filters
Select the Reset Filters button to place all Event filters to their default
values.
The configuration guide is no longer being updated. Please refer to the CloudVision Help Center going forward.
Packaging
The Packaging feature is used to export custom change control actions from one
CloudVision cluster and install them in another. Package IDs and version numbers can be
used to update existing packages with version control.
Accessing Packaging
The Packaging feature is available under Settings tab in the navigation bar.
Figure 1. Accessing Packaging
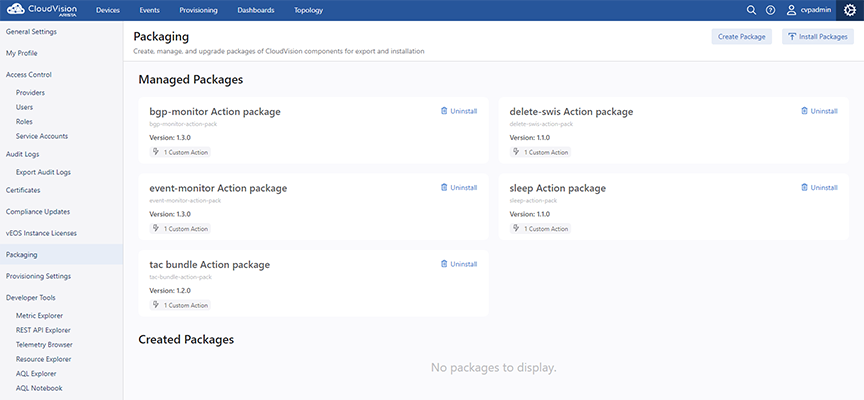
From the Packaging screen, you can create, install, and review packages.There are
two main sections when managing packages:Managed Packages and Created
Packages.
Managed Packages have been imported from another CloudVision cluster and installed.
Hover over the package to review the description.The only available function is to
unistall the selected package.
Created Packages are editable and available for export to another CloudVision
cluster.
Note: Packages can only be edited and exported from,the
cluster where they were created.
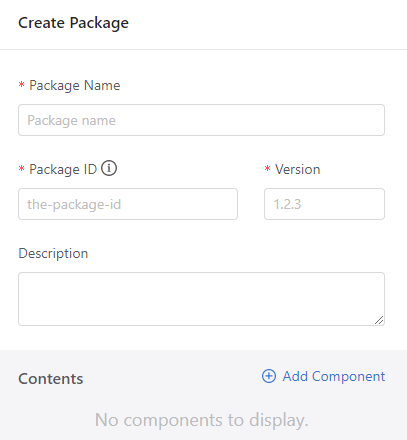
Create a Package
When creating a package you can select the components to be included.You can select
studios, actions, and dashboards to bundle and export. Additional actions to manage the
installation and uninstallation of packages and components can be added.
Creating a Package
From the Packaing screen, select Create Package.
Enter a package name.
Create a unique Package ID and enter a version number.The Package ID should be
human readable.The version number must be three digits(x.x.x).
Note: Make sure that the ID does not match the Package ID of
an existing package, otherwise an existing package may be overwriten.
Enter a description of the package.Figure 2. Creating a Package
Click Add Component and use the dropdown to select actions to include in
the package. Selected actions will appear under Contents
Note: Actions may be executed at different speeds.Limit
the number of components in a package to those that are related and likely
to change together, such as a pair of actions that run before and after a
process.
(Optional) Click Edit below any component name to create a unique
Component ID.
Click Create Package. The package will appear under Created
Packages.
Click Export on the package to download the .tar package file.
Save the file to the appropriate repository so that it can easily be located for
import and installation in another CloudVision cluster.
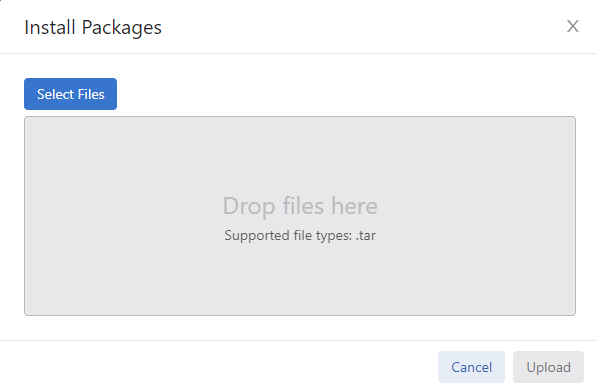
Installing a Package
Packages that have been exported as .tar files from another CloudVision cluster can be
imported and installed.
In the cluster that a packege is to be installed, open the Packaging screen and
click Install Packages.
Select or drag-and-drop the appropriate .tar file into the modal. Multiple
packages may be selected and installed at the same time.
Note: Check the version number and Package ID before
installation to avoid overwriting an existing package.
Figure 3. Installing Packages
Select Upload.
Updating a Package
Updating a package will overwrite an existing package.
Export the package to be overwritten.
If the package to be overwritten is listed under Created Packages it must be
deleted.
Create a new package using the same name as the package to be updated.
Enter the package ID with the same package ID of the original package.
Increase the version number of the original package sequentially.
Proceed to follow the steps for uploading and installing a package,
Note: Before installing an updated package, verify that you
select the .tar file with the appropriate version number.
The configuration guide is no longer being updated. Please refer to the CloudVision Help Center going forward.
Limitations
The following table lists the current limitations of the Telemetry platform. Review the
limitations to ensure you do not inadvertently attempt configurations that exceed the
limitations.
Table 1. CVP Telemetry Platform Limitations
Limitations
Maximum number of devices
This represents the total number of devices currently configured
to stream Telemetry data.
Device-state data
Streaming of LANZ data is not enabled by default. You must enable
it on devices.
Secret configuration
If "enable secret" or "enable password" is configured, the secret
must be the same as the Cloudvision user's password.
The CVP Telemetry Supported Features table lists the supported features. Review the
supported features to ensure you are aware of the features available to you to monitor
devices using Telemetry data.
Table 1. CVP Telemetry Supported Features
Supported Feature
Real-time
monitoring of devices
The Telemetry platform provides interfaces for viewing real-time
updates about changes in device state as well as events. You can
also view trends in device-state metrics and queries of historical
device-state data.
Instant state
change updates
Changes in the state of a device are instantly streamed to CVP.
Full state
change data
All changes in device-state are captured and streamed to CVP for
viewing. Types of device-state include:
All SysDB state (except state under /Sysdb/cell/*).
All SMASH tables.
Process and kernel data (for example, CPU and memory usage).
System log messages
Analytics
engine
The Telemetry platform provides a robust analytics engine that
aggregates the streamed device-state data across devices, monitors
device state, and generates events to indicate issues. It also
normalizes data so it is easier for other applications to
use.
Telemetry
events
Device-state and system environment event types are streamed to
CVP:
Informational (updates about changes in device state).
Warning (for example, unsupported EOS version on a
device)
Errors (data discards or input errors on interfaces, and
more).
Critical (system environment issues such as
overheating).
High
performance database
The Telemetry platform utilizes a high performance Hbase database
to store device-state data, including events. Data is stored in
compressed format without a loss of resolution.
The data storage capacity is approximately:
43200 records worth of raw data per path
5 days of 10 second aggregated data
4 weeks of 60 second aggregated data
3 months worth of 15 minute aggregated data
Disk space
protection
To prevent telemetry data from consuming too much disk space in
the CVP cluster, the Telemetry platform automatically blocks the
ingest port for the entire cluster if disk usage exceeds
85% on any node of the cluster.
Once the ingest port is blocked, it remains blocked until disk
usage drops below 80% on all nodes in the cluster.
Data
management
To ensure that the most relevant data is given priority, the
Telemetry platform provides automated data management,
including:
Maximum time limit on stored device-state data (1 month).
Current and the most recent device-state updates are always
stored (given priority over older state updates).
Periodic clean-up jobs are executed weekly (Saturday at 11:00
P.M.). Old device-state data is purged.
Command
support
Several commands are provided for:
Checking status of the Telemetry components.
Enabling and disabling of Telemetry platform components.
Starting and stopping Telemetry components.
Viewing the debug log for Telemetry components.
Troubleshooting the Telemetry components, including checking
to see that logs are being created for the component.
To display granular information on disk space usage of
telemetry data and delete telemetry data selectively.
Unsupported Features
The CVP Telemetry Unsupported Features table lists the unsupported features. Review the
limitations to ensure you do not inadvertently attempt to configure or use unsupported
Telemetry features.

 Note:
Note: Note:
Note:


.png)


/6.png)